Journal of Civil Engineering and Environmental Sciences
Cool walkability planning: Providing pedestrian thermal comfort in hot climate cities
Todd Litman*
Cite this as
Litman T (2023) Cool walkability planning: Providing pedestrian thermal comfort in hot climate cities. J Civil Eng Environ Sci 9(2): 079-086. DOI: 10.17352/2455-488X.000073Copyright License
© 2023 Litman T. This is an open-access article distributed under the terms of the Creative Commons Attribution License, which permits unrestricted use, distribution, and reproduction in any medium, provided the original author and source are credited.Global warming and urbanization are increasing the number of people living in cities that experience extreme heat. This makes walking uncomfortable, unattractive, and unhealthy and causes travelers to drive for trips that could be made on foot. To address these problems hot-climate cities can create networks of shadeways (shaded sidewalks) and pedways (enclosed, climate-controlled walkways). This article introduces the Cool Walkshed Index (CWI) which rates pedestrian thermal protection from A (best) to F (worst). Currently, most urban neighborhoods have CWI E (incomplete sidewalk networks) or D (complete sidewalk networks). Moderate-heat cities should aspire to CWI C (shaded sidewalks on busy routes); high-heat cities, with temperatures that frequently exceed 38 °C (100 °F) should aspire to CWI B (most buildings located within 300 m of enclosed, climate-controlled pedways); and extreme-heat cities, with temperatures that frequently exceed 43 °C (110° F) should aspire to CWI A (most buildings are located less than 100 m of enclosed, climate-controlled pedways). Analysis in this study indicates that the additional costs of these facilities can be repaid many times over through road, parking, and vehicle savings, and increased local property values.
Introduction
As the world becomes hotter and more urban, pedestrians increasingly experience excessive heat, often exceeding 32 °C (90 °F) and sometimes 43 °C (110 °F) [1]. This makes urban walking uncomfortable, unattractive, and dangerous. This harms pedestrians and causes travelers to drive for trips that could be made by walking, increasing traffic problems, pollution emissions, and sprawl [2].
Walking is the most basic mode of urban travel, serving 12% - 26% of total trips in developed countries, and more in developing countries and in urban areas [3]. Improving walking conditions and increasing pedestrian mode share provides many economic, social, and environmental benefits, including reducing climate emissions [4].
Nearly all modern automobiles and transit systems have air conditioning for passenger comfort. This article identifies ways that cities can provide comparable thermal comfort to pedestrians. It describes shadeways (shaded sidewalks) and pedways (enclosed, climate-controlled walkways), and discusses how the Cool Walkshed Index (CWI) can be used to plan cool pedestrian networks [5]. It discusses their benefits and the business case for developing them. This information should be useful for planners, engineers, and pedestrian advocates in hot-climate cities.
Hot-climate walking comfort
Outdoor physical activity, including walking, is uncomfortable and unhealthy in temperatures over 32 °C (90 °F), particularly with high humidity [6]. Many communities already experience extreme heat, and this is likely to increase with global warming and urbanization [7].
Heat stress is particularly severe in cities due to the heat island effect, which increases ambient temperatures by 1°C - 4 °C due to more dark surfaces (pavement and roofing), reduced green space (such as tree cover), and heat-generating activities (fuel and electricity consumption) [8]. Pedestrians experience severe heat when walking on unshaded sidewalks because they are physically active and absorbing heat from the sun above and radiating from below. Since most public transit trips include walking links, this also discourages public transit travel.
There are many ways to reduce urban heat exposure including designing buildings for natural and mechanical cooling, providing shade, and increasing greenspace and tree cover [9]. Pedestrians can be protected with shadeways (sidewalks and paths with at least 80% shade coverage during peak sun periods) and pedways (enclosed climate-controlled walkways) [10].
Currently, most shadeway and pedway planning is ad hoc, built where they are visible and convenient to construct, not necessarily where they are most needed. A more systematic approach is required to develop integrated hot-climate pedestrian networks. To be effective these must be planned as networks that provide convenient and comfortable pedestrian connections between homes, services, and public transit within an urban village, a compact, mixed activity center where commonly-used services are within walking distance.
Shadeways
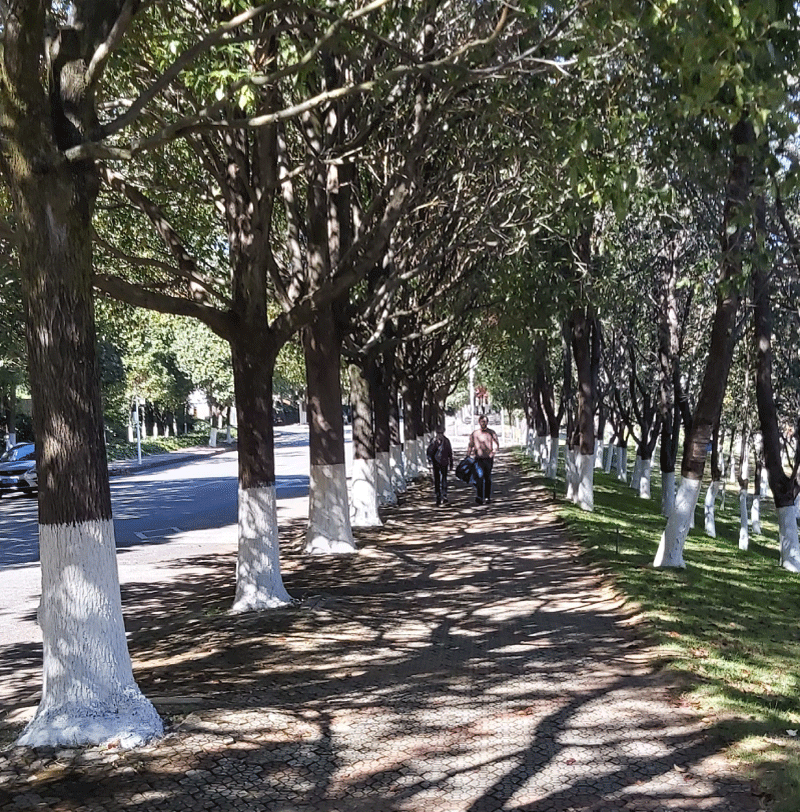
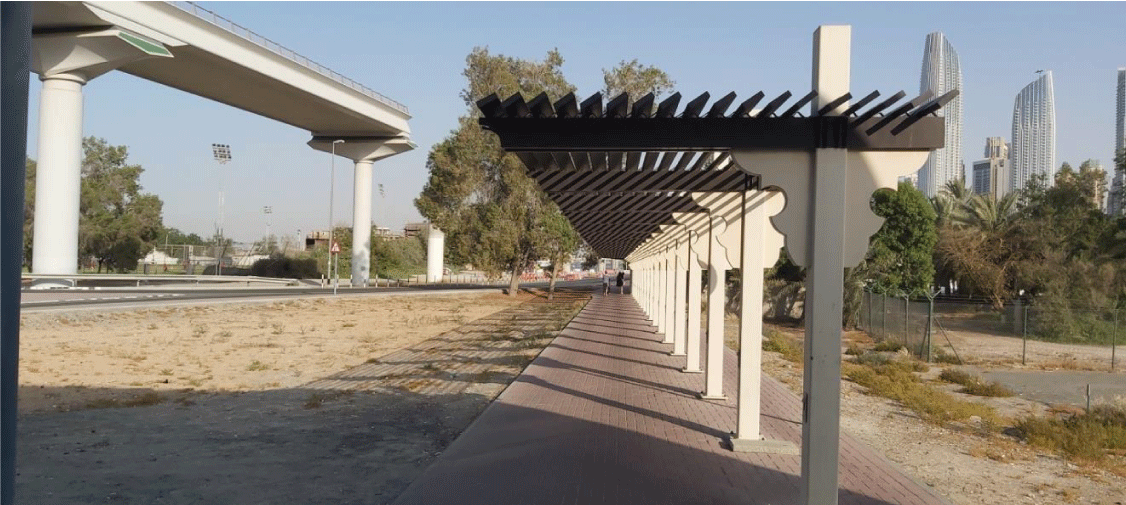
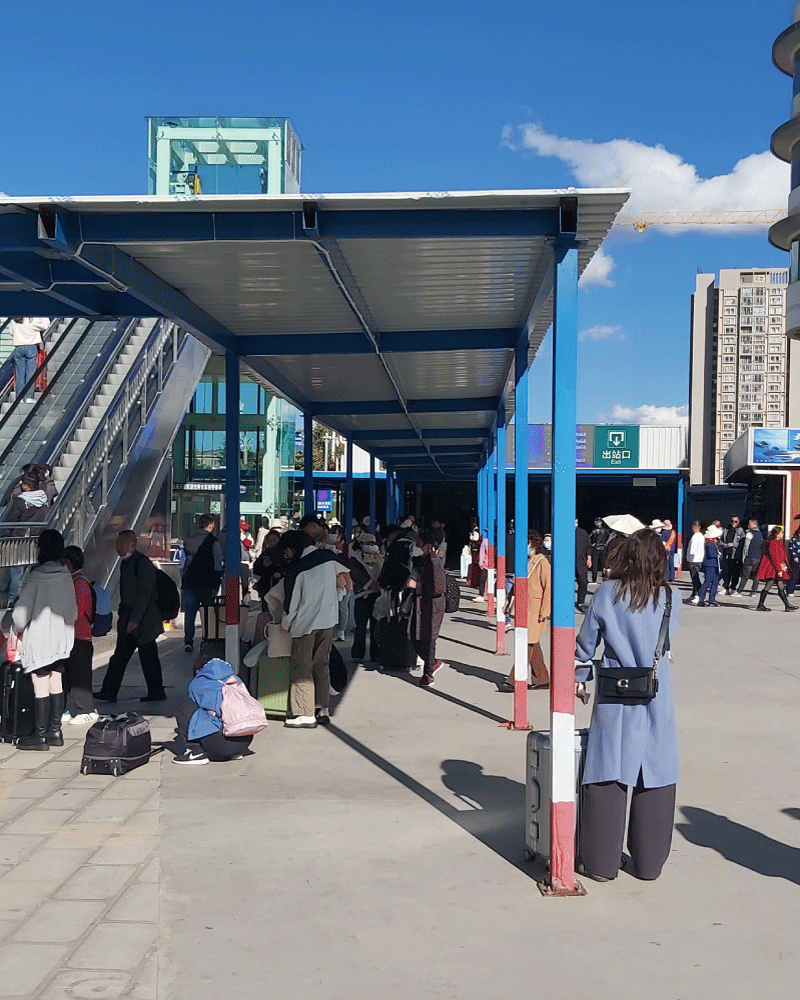
The following photographs illustrate examples of shadeways (Figure 1).
Trees can provide beautiful shade but they require adequate space plus reliable water, and take many years to grow. Trees alone can seldom provide sufficient shade; structures are usually needed. There are many possible designs including metal, wood, and fabric (Figures 2,3). Awnings also provide protection from rain and snow. In extreme dry heat, walkways can incorporate misting systems to provide natural outdoor cooling, but these add costs, consume water, and are not generally suitable for large areas.
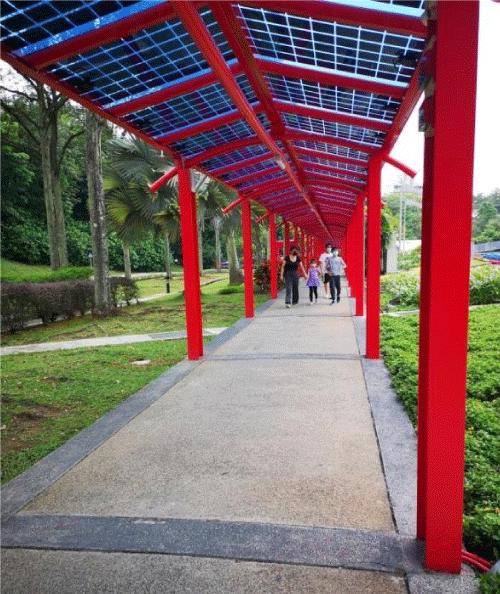
Shadeways can incorporate solar panels, such as the walkway connecting the Singapore Discovery Centre with a nearby bus stop, as illustrated below. These can power pedway cooling systems (Figure 4).
Pedways
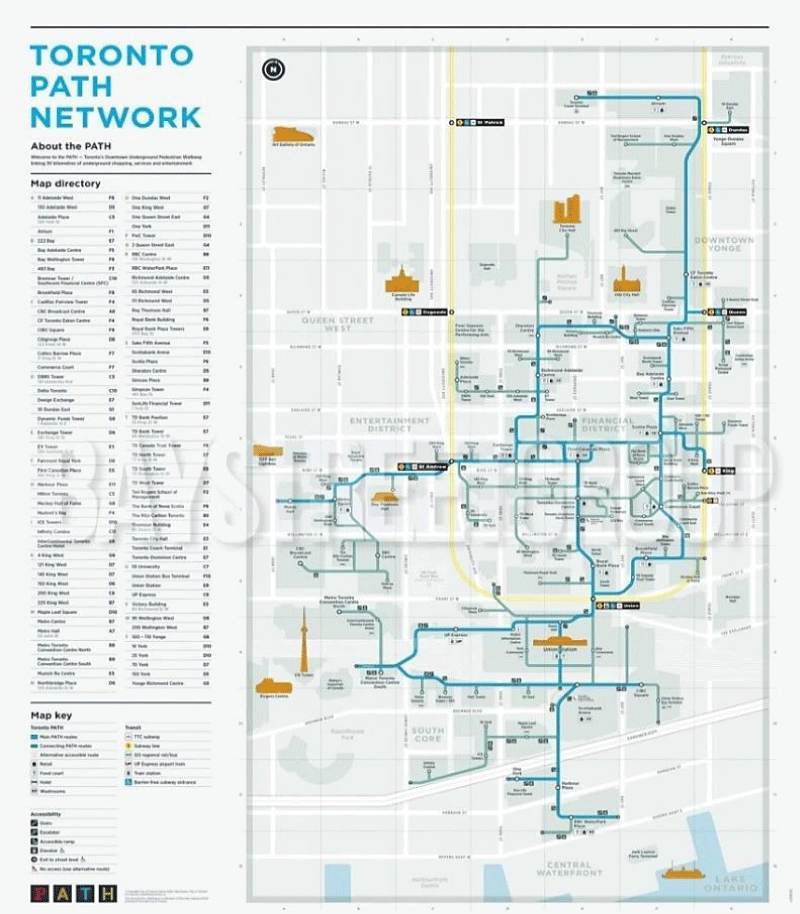
Many cold-climate cities and some hot-climate cities have pedway networks to protect pedestrians from extreme weather. A good example is downtown Toronto’s PATH Pedway Network which has 30 kilometres of enclosed walkways that connect more than 75 buildings, six subway stations and the main train station, three major department stores, nine hotels, and many entertainment attractions. Each pedway segment is managed and maintained by the owner of the property through which it runs; about 35 corporations are involved. Their operating costs are repaid through higher property values and rents paid by shops incorporated into the network (Figure 5).
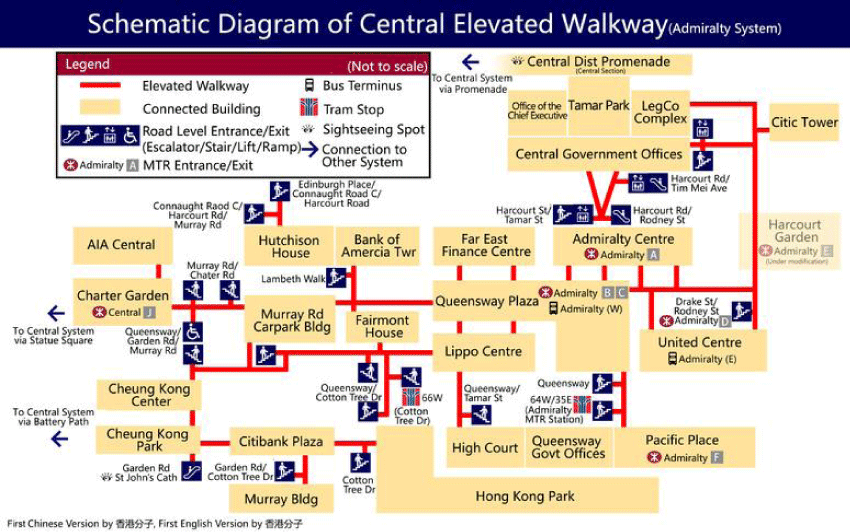
Similar pedway networks exist in other cold climate cities such as Chicago, Edmonton, and Montreal, and in some hot climate cities such as Bangkok, Hong Kong, Kuala Lumpur, and Singapore. Hong Kong has two multi-level walking networks, the Central System and the Admiralty System, which connect many buildings, transit stations, and attractions through a combination of elevated and shaded pathways, plus air-conditioned corridors in commercial buildings (Figure 6).
Seoul, South Korea, and Taipei, Taiwan have well-developed underground networks that connect metro stations to popular attractions such as shopping centers and museums. Many Chinese cities also have underground pedway networks. The Zhujiang New Town network connects metro stations to the basements of over 35 office towers, numerous shopping malls, medical centers, and other downtown attractions. Guangzhou has more than 16 pedways around rail stations.
The Cool Walkshed Index (CWI)
The Cool Walkshed Index (CWI), summarized below, is designed to help plan urban walksheds to improve pedestrian thermal comfort. CWI ratings can be used to evaluate hot-weather pedestrian accessibility for a building or neighborhood, identify where shadeways and pedways are justified, and set targets for improvements.
The proposed outdoor walking distance limits (300 m where ambient temperatures frequently exceed 38 °C and 100 m where temperatures frequently exceed 43 °C) reflect the lower range of acceptable distances between buildings and parked vehicles or subway stations in urban areas [12].
Currently, most cities have CWI ratings of E (incomplete and largely unshaded sidewalks and paths) or D (complete but largely unshaded sidewalk and path networks). A few areas have well-developed shadeways that provide C ratings, or pedway networks that provide B or A ratings.
CWI ratings can help individuals make better location decisions and communities make better planning decisions. For example, families may choose homes with higher CWI ratings, and property owners can pay for shadeway and pedway connections in order to raise their CWI ratings.
Of course, shadeways and pedways must be properly designed and managed. They should reflect universal design principles to accommodate all types of users including people with disabilities, families with children, and travelers with hand carts and wheeled luggage [13]. They should have sufficient capacity to avoid crowding and be well-maintained for comfort, safety, security, and attractiveness.
Impacts to consider
The following impacts should be considered when evaluating cool walkshed networks.
Travel impacts: Pedestrian facility improvements can significantly increase walking and reduce driving, particularly in affluent cities where many travelers can afford to drive [14]. Neighborhoods with excellent walkability often have 20% to 50% walking mode shares and much lower vehicle ownership and use than auto-oriented areas [15]. Ambient temperatures significantly affect walking, particularly by women, children, and seniors [16]. For example, in Doha, Qatar, walking trips declined 57% during summer days when temperatures ranged from 35-42 °C (95-108°F), compared with winter when temperatures ranged from 20-28 °C (68-82°F), suggesting that shadeways and pedways can significantly increase walking and public transit, and reduce driving [17].
Benefits
Improved user comfort and fitness: Walkability improvements directly benefit pedestrian, and increasing active travel improve public fitness and health.
Social equity: Shadeways and pedways ensure that physically and economically disadvantaged travelers, who often rely on non-auto modes and are vulnerable to extreme weather, have comfortable and healthy walking conditions and receive a fair share of transportation infrastructure investments [18].
User savings: Residents of walkable urban villages typically own 40-60% fewer vehicles and drive 40-60% fewer annual kilometers than comparable households in auto-dependent areas [19], providing thousands of dollars in annual savings per capita [20].
Increased property values, business activity, and tax revenues: Residential and commercial property values tend to increase with improved walkability and public transit access. One study found that a 10-point increase in Walk Score is associated with a 5% to 8% increase in commercial values [21]. Businesses located in walkable commercial districts tend to have more customers and sales and generate more tax revenue [22].
Reduced traffic problems: Improving active travel conditions can reduce automobile travel and associated costs. Residents of walkable urban villages typically make about half as many vehicle trips as in conventional, automobile-oriented areas, which reduces road and parking facility costs, traffic congestion, crash risk, and pollution emissions.
Costs
Construction costs: Shadeways and pedways are more expensive than basic sidewalks and paths. Constructing a typical 3-metre-wide sidewalk costs $100 to $500 per linear meter, depending on materials and conditions [23]. Adding a fabric canopy approximately doubles those costs, and a sturdy wood or metal awning typically costs $1,000 to $2,000 per linear meter [24]. Enclosed pedways are even more expensive, particularly if they require tunneling or overhead structures. Costs are lower for pedways developed in conjunction with building and roadway projects, and higher when they are retrofitted or where conditions are particularly challenging.
Operating costs: Property owners may face additional operating, administration, and liability costs.
Urban design and energy impacts: Urbanists sometimes criticize pedways for being sterile, privatized spaces that remove pedestrians from the public realm, reducing access to small shops and street activity, and excluding lower-income people [25]. They are also criticized for their air conditioning energy consumption. Such criticism may be legitimate if pedways substitute for walking on vibrant public sidewalks, but not if travelers would instead travel by car or stay at home. Well-designed pedway networks can increase total walking, reduce automobile traffic and associated costs, make city living more attractive and successful, and reduce sprawl-related costs. Pedway energy and financial costs are much less than automobile travel.
Table 1 summarizes shadeway and pedway benefits and costs.
Because they are expensive, pedways are mainly justified in dense urban villages where buildings are close together. It would be costly to connect all buildings in a neighborhood to pedways; a more realistic goal is to achieve CWI B, meaning that where ambient temperatures frequently exceed 38 °C (100 °F) most buildings are located within 300 m (1,000 feet) a pedway entrance; and where temperatures frequently exceed 43° Celsius (110 °F) most buildings are located within 100 m (300 feet) of a pedway entrance.
Business case example
As previously described, typical jurisdictions currently spend about $50 annually per capita to build and maintain public sidewalks and paths, but these are generally incomplete, with many streets lacking sidewalks and many sidewalks failing to meet universal design standards. A few jurisdictions, such as Albuquerque, Denver, Los Angeles, and Washington State spend about twice that to complete their sidewalk networks and meet standards [26]. Building shadeways on main sidewalks (those on arterials, around shopping districts, and to schools) would probably require an additional $50 annually per capita. Although costs vary widely depending on conditions, pedway costs are likely to be similar to the costs of adding an urban arterial lane, which currently averages $5-15 million [27].
Assume that in a typical urban village, a basic pedway network that provides CWI B requires two miles of pedway, and a more complete pedway network that provides CWI rating A to most homes and worksites requires four miles of pedways.
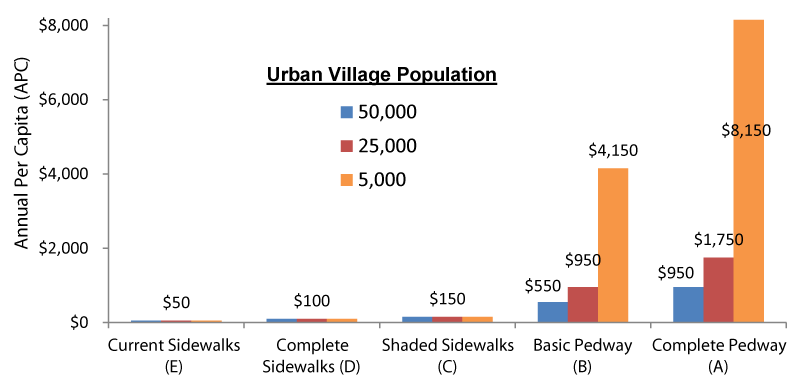
The figure below compares the costs of achieving various CWI ratings. CWI E (the incomplete sidewalk networks that currently exist in most communities) costs about $50 annually per capita (APC). CWI D (a complete sidewalk network) costs about $100 APC. CWI C (shaded sidewalks on main routes) is estimated to cost about $150 APC. CWI B (a basic pedway network that provides enclosed walkways close to most homes and worksites) would cost between $550 APC if the costs are distributed among 50,000 residents/workers or up to $4,150 if distributed among just 5,000 people. CWI A (a complete pedway network connecting most residences and commercial buildings) would probably cost between $950 and $8,150 annually per capita, depending on the area population (Figure 7).
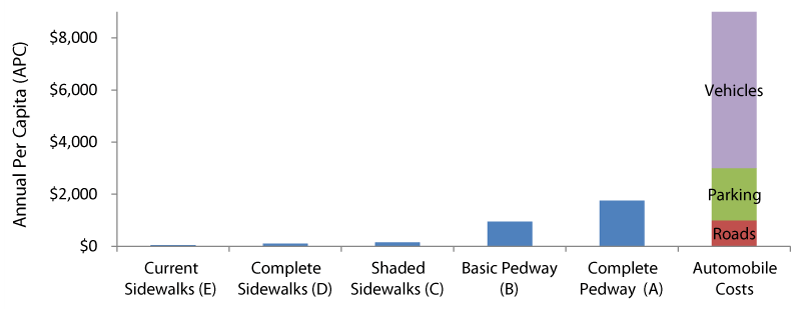
Are these facilities expensive? Comprehensive shadeway and pedway networks require large increases in pedestrian spending, which makes them seem costly. However, they are inexpensive compared with what governments currently spend on roads and traffic services (about $1,000 annually per capita), what businesses spend on parking facilities (more than $2,000 annually per capita), and what motorists currently spend on vehicles (about $6,000 annually) [28]. If shadeway and pedway investments provide small reductions in vehicle, road, and parking facility costs they can more than repay their investments, and provide other economic, social, and environmental benefits. They become more cost-effective if developed during building and roadway construction (which minimizes their costs); in compact urban villages (which maximizes their usefulness); and if implemented with TDM incentives (which increases their use).
The figure below compares the estimated additional per capita costs of developing walkshed networks CWI B ($750) and CWB A ($1,750) for a mid-size urban village with total expenditures on roads, parking, and vehicles for automobile travel ($8,000). Measured this way, pedways are cost-effective if they allow households to reduce their vehicle costs by 10% - 20%, considering financial costs only. Since living in a walkable urban village can reduce total vehicle costs by 40% - 60% compared with automobile-dependent areas, pedway networks can repay their costs several times over. Their cost-effectiveness is even greater considering additional benefits such as improved health, more independent mobility for non-drivers, and reduced environmental damages (Figure 8).
Improved walkability often increases property values by 5% - 15%, and more if it provides access to high-quality public transit [29]. A pedway network that connects dozens of residential and commercial buildings can generate millions of dollars in total annual savings and economic benefits. Some of this value can be captured through connection fees or special taxes. This indicates that in hot climate cities where many residents would otherwise travel by automobile, pedway network development can be very cost-effective and beneficial. Their costs can often be repaid through road and parking infrastructure savings, and increased property values.
Factors to consider in shadeway and pedway planning
Local climate and topography: Shadeway and pedway benefits are greatest in areas with extreme heat, cold, rain, snow, pollution smoke, or dust. The more severe and frequent these conditions, the greater the shadeway and pedway benefits.
Development density and mix (Urban Villages): The more people, jobs, and services located within a walkshed, the more people will walk and benefit from pedway and shadeway networks.
Facility quality: To maximize benefits, shadeways, and pedways should be well-designed and managed. They should meet universal design standards, be clean, comfortable safe, and seldom crowded, include clear wayfinding, and have points of interest to make them attractive destinations. They should be managed similarly to other enclosed semi-public spaces such as public transit facilities and shopping malls.
Integration: Because they experience economies of scale, shadeways, and pedways should connect to the maximum number of homes, services, and destinations. They should be integrated with overall pedestrian networks and with public transportation networks. Their benefits tend to increase with public transit service improvements and TDM incentives, such as efficient parking pricing and commute trip reduction programs, which encourage travelers to walk rather than drive.
Social equity goals: Because many physically and economically disadvantaged people walk and are vulnerable to extreme weather, shadeway and pedway networks help achieve social equity goals. Where possible, they should connect to affordable housing and public services commonly used by disadvantaged groups.
Business models: Pedways can be financially self-sustaining, their costs repaid through connection fees, rents, and tax gains. Pedways can be linear shopping centers with commercial spaces that pay rent. Local governments can either require or provide incentives for building owners to connect and maintain their portion of the network. Public transit agencies can support pedways as extensions of their stations. Local governments and business associations can promote and sponsor activities that attract more customers, residents, and businesses to these networks.
Conclusion
Improving walkability can provide significant benefits to people, businesses, and communities, particularly in dense urban areas where vehicle traffic imposes high costs. Since extreme heat and colds make walking uncomfortable and unhealthy, it is important to plan for pedestrian thermal comfort.
Well-designed shadeway and pedway networks in compact urban villages can provide convenient, comfortable, and efficient non-auto access under all weather conditions. This is justified for equity sake, to ensure that non-drivers enjoy thermal comfort, and to achieve numerous benefits provided by walkability and compact development.
Many cities have some shaded sidewalks and air-conditioned walkways but few have comprehensive, integrated shadeway and pedway networks that connect a major portion of destinations. The Cool Walkshed Index (CWI) is a practical way to evaluate walking thermal comfort. It can be used to rate a building or area’s hot weather pedestrian access and to plan improvements. Currently, most urban neighborhoods have CWI E (incomplete sidewalk networks) or D (complete sidewalk networks). Moderate-heat cities should aspire to CWI C (shaded sidewalks on busy routes); high-heat cities, with temperatures that frequently exceed 38 °C (100 °F) should aspire to CWI B (most buildings located within 300 m of enclosed, climate-controlled pedways); and extreme-heat cities, with temperatures that frequently exceed 43 °C (110° F) should aspire to CWI A (most buildings located less than 100 m of enclosed, climate-controlled pedways).
To be successful these networks require effective planning. Shadeways are somewhat more costly and pedways much more costly than basic sidewalks, so creating these networks requires significant investments, but their costs are far less than what governments spend on roads, businesses spend on parking facilities, and motorists spend on vehicles, so their costs are can usually be repaid many times over through user and infrastructure savings, and other benefits. These networks are most cost-effective if integrated into compact urban villages and implemented with TDM incentives that encourage their use. They experience economies of scale, becoming more cost-effective and beneficial as they expand and connect more people, businesses, and services. As a result, property owners should be encouraged or required to connect to them.
Thanks to Shoshana Kort Litman, Stefan Gössling, Khaled Shaaban, and all of my colleagues in Dubai who contributed to this analysis.
- Lenton TM. Quantifying the Human Cost of Global Warming. Nature Sustainability. 2023. https://doi.org/10.1038/s41893-023-01132-6.
- Gössling S. Weather, Climate Change, and Transport: A Review. Natural Hazards. 2023; 1. DOI: 20. 10.1007/s11069-023-06054-2.
- Buehler R, Pucher J. Overview of Walking Rates, Walking Safety, and Government Policies to Encourage More and Safer Walking in Europe and North America. Sustainability. 2023; 15:7. https://doi.org/10.3390/su15075719.
- Brand C. The Climate Change Mitigation Effects of Daily Active Travel in Cities. Transportation Research Part D. 2022; 93. https://doi.org/10.1016/j.trd.2021.102764.
- Litman T. Cool Walkability Planning, Victoria Transport Policy Institute. 2022. (www.vtpi.org); at www.vtpi.org/cwi.pdf.
- WHO (2018) Heat and Health. World Health Organization (www.who.int); at https://bit.ly/3O72CLO.
- UCCRN (2018) The Future We Don’t Want: How Climate Change Could Impact the World’s Greatest Cities, Urban Climate Change Research Network. (https://uccrn.ei.columbia.edu); at https://bit.ly/3ovpXwR.
- USEPA (2023) Learn About Heat Islands, US Environmental Protection Agency. (www.epa.gov); at www.epa.gov/heatislands/learn-about-heat-islands.
- Ladd K, Meerow S. Planning for Urban Heat Resilience, PAS Report 600, American Planning Association. 2022; (www.planning.org); at www.planning.org/publications/report/9245695.
- ADUPC (2009) Abu Dhabi Urban Street Design Manual. Abu Dhabi Urban Planning Council (www.dmt.gov.ae); at https://bit.ly/3qadyP3.
- SBPR (2020) Longest Sheltered Walkway Fitted with Solar Panels. Singapore Book of Records (https://singaporerecords.com); at https://singaporerecords.com/longest-sheltered-walkway-fitted-with-solar-panels.
- Pueboobpaphan R, Pueboobpaphan S, Sukhotra S. Acceptable Walking Distance to Transit Stations in Bangkok, Thailand. Journal of Transport Geography. 2022; 99. (https://doi.org/10.1016/j.jtrangeo.2022.103296).
- NTA (2021) Universal Design Walkability Audit Tool, Centre for Excellence in Universal Design. (https://universaldesign.ie); at https://bit.ly/3INPZCm.
- CPSTF (2017) Physical Activity: Built Environment Approaches Combining Transportation System Interventions with Land Use and Environmental Design, USCDC. (www.thecommunityguide.org); at https://bit.ly/3jnTwIg.
- Buehler R, Pucher J. Overview of Walking Rates, Walking Safety, and Government Policies to Encourage More and Safer Walking in Europe and North America. 2023; 15: 5719.
- Shaaban K, Muley D, Elnashar D. Temporal Variation in Walking Behavior: An Empirical Study. Case Studies on Transport Policy. 2017, DOI: 10.1016/j.cstp.2017.07.001.
- Shaaban K, Muley D. Investigation of Weather Impacts on Pedestrian Volumes. Transportation Research Procedia. 2016; 14: 115-122 doi:10.1016/j.trpro.2016.05.047.
- Todd Litman (2022) Fair Share Transportation Planning, World Conference for Transportation Research; at www.vtpi.org/fstp.pdf. www.vtpi.org/fstp.pdf.
- CNT (2022) Total Driving Costs: H+T Affordability Index, Center for Neighbourhood Technology (https://htaindex.cnt.org); at https://htaindex.cnt.org/total-driving-costs.
- Scheer B. How Does Transportation Affordability Vary Among TODs, TADs, and Other Areas?, National Institute for Transportation and Communities. 2017. (www.nitc.us); at https://bit.ly/40r1Iyj.
- Alfonzo M. Making the Economic Case for More Walkability, Urban Land Institute. 2015. (https://urbanland.uli.org). at https://urbanland.uli.org/sustainability/houston-economic-case-walkability.
- ALR (2013) Business Performance in Walkable Shopping Areas, Active Living Research. (https://activelivingresearch.org); at https://bit.ly/3OIhyAP.
- Litman T. Completing Sidewalk Networks: Benefits and Costs, Victoria Transport Policy Institute. (www.vtpi.org). 2024. at www.vtpi.org/csn.pdf.
- Based on data from commercial suppliers such as Upside Innovations (https://upsideinnovations.com). Darshan (www.darshanpeb.com) and Duo-Gard Industries (www.duo-gard.com).
- Ponting A, Lim V. Elevated Pedestrian Linkways - Boon or Bane?, Centre for Liveable Cities. 2015. (www.clc.gov.sg); at https://bit.ly/3sr5F9M.
- Litman (2024)
- FHWA (2020) Appendix A: Highway Investment Analysis Methodology,” Status of the Nation's Highways, Bridges, and Transit, USDOT (www.fhwa.dot.gov); at www.fhwa.dot.gov/policy/23cpr/appendixa.cfm.
- Litman (2022)
- Mariela Alfonzo (2015), Making the Economic Case for More Walkability, Urban Land Institute (https://urbanland.uli.org); at https://bit.ly/3QW4Cbd. (https://urbanland.uli.org); at https://bit.ly/3QW4Cbd.
Article Alerts
Subscribe to our articles alerts and stay tuned.
 This work is licensed under a Creative Commons Attribution 4.0 International License.


 Save to Mendeley
