Journal of Civil Engineering and Environmental Sciences
Reflectance study of soil silt using proximal sensing in Northern Iran
Majid Danesh1*, Mohammad Ali Bahmanyar2 and Seyed Mostafa Emadi2
2Department of Soil Engineering and Science, Sari Agricultural Sciences and Natural Resources University (SANRU), Iran
Cite this as
Danesh M, Bahmanyar MA, Emadi SM (2022) Reflectance study of soil silt using proximal sensing in Northern Iran. J Civil Eng Environ Sci 8(1): 048-056. DOI: 10.17352/2455-488X.000050Copyright License
© 2022 Danesh M, et al. This is an open-access article distributed under the terms of the Creative Commons Attribution License, which permits unrestricted use, distribution, and reproduction in any medium, provided the original author and source are credited.The study of silt fractions using the traditional methods, especially on large scales, is time-consuming, laborious, and costly. The present work intends to investigate the spectral behaviors of the soil silt fraction using reflectance spectroscopy technology. Accordingly, 128 soil samples were collected from 20cm of soil surface of Mazandaran province, northern Iran. First, the sample set was subdivided into calibration and validation subsets. Spectral signatures of silt components were detected utilizing the PLSR algorithm and Cross-Validation technique. The final model with 4 LFs was calibrated with these specs: Rc: 0.55, RMSEc: 8.31%, RPDc: 1.20, and RPIQc:1.71 and was eventually selected as the best model for studying the soil silt of Mazandaran province. The obtained spectral wavebands with the highest correlation coefficients (R(CCmax)) indicate the high impact as the independent predictors in the processes of modeling. Finally, the capability of the proximal sensing technology (VNIR-PS) was proved in examining the silt content of Mazandaran province. Also, the most influential spectral domains and ranges were detected and recognized. Our findings can be used as a basis for studying silt content on a large scale by applying the upscaling process via airborne/satellite hyperspectral data.
Subject classification codes: Soil Conservation, Proximal Soil Sensing, Soil Spectral Modeling
Introduction
Continuous monitoring of soil is very important. Because the soil loss is considered to be a major threat with negative impacts on ecosystem services, crop production, water resources, carbon stock, and biodiversity. Also, soil can directly affect global events such as warming, climate change, and desertification [1,2]. And most importantly, one of the main factors affecting the rates of soil erosion is soil texture property [3]. In addition, having info on soil silt content is of great importance in many environmental views such as soil erodibility, degradation, and desertification processes. As shown in the research, soils with high silt content have much more unstable aggregates, erodibility, and runoff [4-7]. Mapping of soil silt components is required in many fundamental types of research. In this regard, proximal sensing technology in the theVis-NIR-SWIR spectral ranges appears as a promising tool that scans soil quickly and nondestructively. This technology can create a modern revolution in characterizing and monitoring some soil properties [6-13].
From the viewpoint of soil spectral signatures in the reflectance range of Vis-NIR, Soil Spectral Reflectance Curve (SSRC) is concave specifically in the spectral range of 400-2500 nm. It is also strongly influenced by some properties such as moisture, texture (particle size distribution), structure, organic material, lime, and type of clay minerals [6,7,14-17]. Mineralogically soil texture components can directly affect the Soil Optical Properties (SOP) [6,9,13]. The incident light (spectrum) will trap the coarser soil constituents and causes the signatures over the soil reflected spectra [16]. Generally, the size and shape of aggregates affect the soil’s spectral reflectance. The larger the soil particle diameter, the lower the intensity and magnitude of soil reflected spectra. In addition, the shape of aggregates depends on the textural components and structure of the soil. Hence the smooth surface which consists of more spheroidal aggregates has a higher spectral reflectance than the unsmooth soil surface [9,16]. Matney, et al. [18] showed the suitability and usefulness of proximal sensing in the range of Vis-NIR to examine the wide range of soil properties. In addition, Summers, et al. [19] and Stenberg, et al. [20] studied and measured soil texture components with appropriate accuracy. Pietrzykowski and Chodak [21] using the Vis-NIR spectroscopy proved the main differences between the spectral features of studied soils were because of the diversity of texture constituents (PSD) as well as the parent material. Subsequently, Ostovari, et al. [5]; Xu et al. 2018a&b [11,12] and Peng, et al. 2020 [6] performed an estimation of soil textural properties using lab spectroscopy with acceptable model accuracy. Moreover, Zhao, et al. 2020 studied the soil clay content using an advanced spectrostatistical approach with great results. Curcio, et al. [22] also achieved moderate accuracy for the silt prediction process with R2 of 0.60 and RMSE of about 7.2% utilizing the PLSR chemometric approach and CRT-SSAF (Continuum Removal Technique for Special Spectral Absorption Features). As well they detected and determined the spectral key-bands as the predictors of soil texture components. These wavelengths utilize for investigation of the texture using the upscaling process and spaceborne/airborne remotely sensed data on large scales. The research conducted by Small, et al. [23] showed distinct linear relationships between the silt component and the spectral absorption features in the visible range of reflected spectra. Similarly, Rawlins, et al. [24] predicted the soil texture constituents utilizing the visible-NIR proximal sensing technology regarding the soil parent material. Also using the PLS algorithm, they estimated silt content as well as the spectral behaviors and signatures with moderate accuracy. Moreover, Gomez, et al. [4] had a good evaluation of some soil characteristics such as soil texture using the spectroscopy and multiple linear regression method. But silt component was predicted with less accuracy. The present research aimed to i) study the key wavelengths of soil silt in the Visible-NIR-SWIR using the proximal sensing technology ii) analyze the spectral signatures and behaviors of silt components by applying the advanced spectrostatistical approach to proving the capability of the technology in Northern Iran.
Materials and methods
Sampling operation
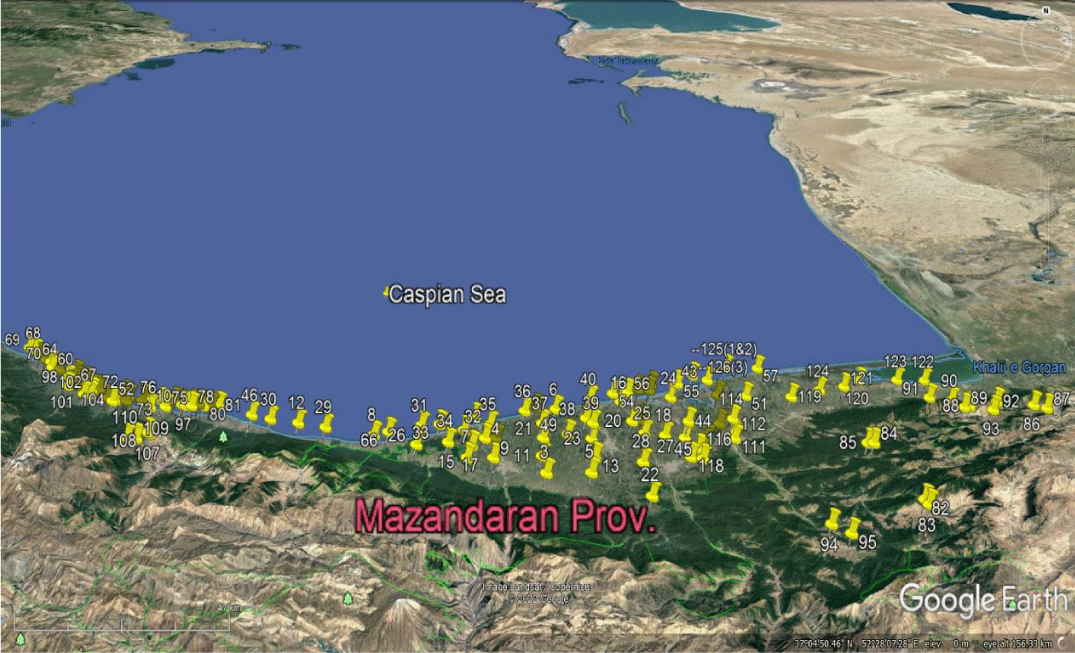
Based on information such as geology, soil, land use, and also a road map of the province128 samples according to the stratified randomized sampling method [25] were collected from 20cm of soil surface of Mazandaran, Iran. Their locations were registered using the handheld GPS, Garmin Montana 650 with an accuracy of about 4m (Figure 1). In the soil lab after some pretreatments, each sample was divided into two parts. The first was allocated for the determination of silt particles ratio using the hydrometer method [26] and the second was transferred to the darkroom of the spectral lab.
Spectrostatistical approach
PLSR is one of the most common multivariate statistical procedures is used for spectral calibration and soil properties prediction [5,6,11-15,27]. It extracts the successive linear compounds from estimators which optimally consider the Y-explained and the X-explained variances [6,9,13].
Results and Discussion
Statistical analysis
ANOVA indicates the little variability of the soil silt (Table 1). Furthermore, the minimum and maximum values were 16% and 65% respectively. The distribution of silt contents was normal without outlier based upon the Kolmogorov-Smirnov normality, Q-Q plot, and Box-plot tests. Also, there were multi-modal status, skewness (0.248), and kurtosis (0.249) based on the statistical distribution (Table 1).
Visual Analyses of Spectral Reflectance Characteristic Curve (SRCC)
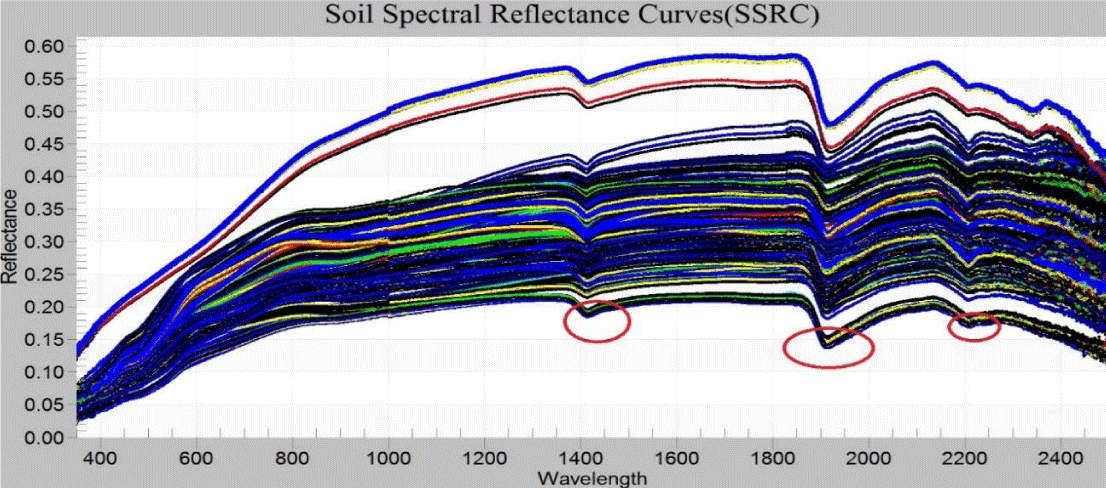
Changes in the reflectance intensity are often due to the differences in soil particles size and textural components (Figure 2). Thus soils with finer particles probably have much more reflected energy throughout the spectrum [17,28]. The most obvious spectral absorption features which are specifically influenced by texture constituents can be seen in Figure 2 (around 1400, 1900 and 2200nm) [6,13,17,29,30]. The apparent absorption feature is around 2200 nm as a result of spectral interaction with the mineralogical Al-OH group (Figure 2) [5,9,10,28]. As stated by some studies absorption peaks about 1400 and 1900 nm are related to the presence of both kinds of water: crystallized and hydrated. Also, the spectral events around 2000 to 2500 nm can be connected with the properties of soil minerals [6,11].
Calibration process
Before calibration samples were randomly divided into two parts: 75% for model creation and 25% for model validation. To ensure the proper distribution of samples as well as the correspondence of the two parts, Kolmogorov-Smirnov (KS) (Table 2) Student’s T and Levene’s tests were done [8]. The results showed full correspondence of both groups at a 1% significance level (Table 2).
Since predictors have many multi-collinearity to create an apt estimative model, the appropriate model with the optimum number of latent vectors (LV) should be utilized [27]. Hence the full-LOOCV technique was used to gain the optimum index factor (OIF), favorite LV number, and avoid overprediction error during the process. The best number of LVs were 4 factors for studying the silt contents of the area based on the analyses of dependent and independent variables as well as the minimum RMSEcv and the maximum R2cv values in the calibration subset (Figure 3 A, B, E, F, M, N, S). Therefore the best and most optimum LVs were determined as the constituent of the silt predictive model while having the maximum descriptive variances (Figure 3 A-H). Consequently in accord with the independent and dependent residual variances as well the descriptive variances of silt content and spectral variables (Figure 3 A-G, S-V) the most of spectral and silt changeability can be investigated applying 4 principal components (PCs). According to the Hotelling T2 test on adjusted leverage (Figure 3 H-J, U, V) likewise, the influence test (IFt) (Figure 3 H-L, W, X) proved the minor part of sample-set had a strong effect on the silt modeling process. It is due to the multi-modal sample distribution and slight variability characteristics. Based on IFt and residual values of variance from Hotelling and Leverage tests found that most of the residuals were lower than Hotelling T2 and leverage statistics which indicated the absence of heterogeneous data during the modeling process in the research (Figure 3 H-L, U, V, X). In the next step, the most influential spectral wavebands were calculated and determined using the B-coefficients, weight analysis, and Martens’ uncertainty test (Figure 3 O-R). Therefore the most efficient spectral domains in the prediction of silt particles were well recognized (Figure 3 O-Q). Accordingly, the reflectance ranges of UV, Vis, NIR, and SWIR have been used effectively in the soil study of Mazandaran province (Figure 3 O-R). The normality test of residuals based on four latent vectors (LV= 4) and comparison of y-residual vs y-predicted showed the moderate quality of the silt predictive model in the soils studied in the province (Figure 3 M, N, S, T). The final estimative model utilizing the principal components process (PC=4) was eventually calibrated with the following specs, Rc: 0.55, R2c: 0.30, RMSEc: 8.31, SEc: 8.35, the approximate slope of 0.298, and with the defined bias (Figure 3 M & Figure 4). The final calibrated model was specified as the most desirable model to predict the silt constituent in soils of the study area (Figure 3 M, N & Figure 4). The specifications of the total predicting model besides the statistical results are shown in Figure 4. Subsequently, the final quality and accuracy of the model were calculated using two analytical statistical indicators: RPD and RPIQD [31,32]. Based on the LF=4: RPDc and RPIQc were 1.20 and 1.71 respectively. These indices showed the model quality and power are slightly moderate in predicting the silt parameter across the soils of the province.
Validation process
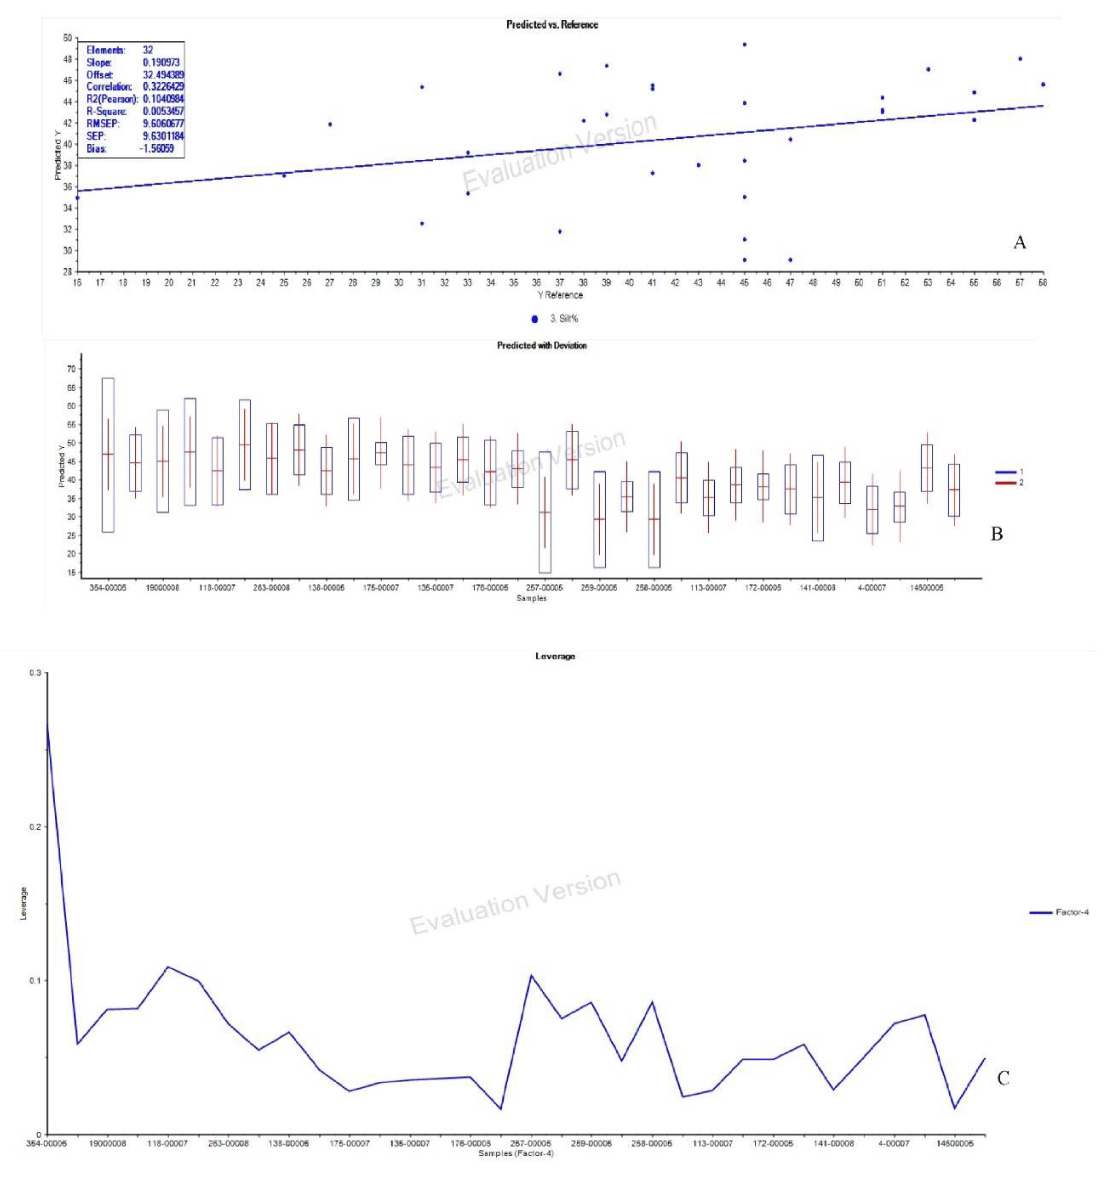
The accuracy assessment and the evaluation of the silt predicting model using 32 samples of the separate standalone subset (which were not entered into the calibration process) were done. According to the model obtained from the calibration subset (Figure 4), the silt contents of the study area were estimated by the reflectance data of 32 independent variables and then compared with the reference values (Figure 5). Finally, the silt content of the study area was predicted with slightly acceptable accuracy in the validation subset. Figure 5-A shows the predicted vs the reference contents in the independent validation subset based on the LV= 4. In addition, the chart of the estimated values in the standard deviation range was calculated and drawn (Figure 5-B). The results of this step were as follows: Rp (the mutual correlation coefficient in the prediction subset): 0.32, R2p (the regression coefficient in the prediction subset): 0.10, RMSEp (root means a square error of the prediction process): 9.61%, SEp (standard error of prediction): 9.63 and with the defined bias around -1.56 (Figure 5 & Table 3). Similarly, the leverage values were calculated based on the adjusted leverage test for the fourth component in Figure 5-C. Moreover, the accuracy parameters of the estimating model were assessed based on RPDp and RPIQp (Chang and Laird 2002) 1.02 and 1.14 correspondingly (Figure 5 & Table 3). Finally, it was found the prediction stage of the silt constituent in Mazandaran soils, in northern Iran, was relatively moderate in terms of quality and strength of the model (Figure 5 & Table 3).
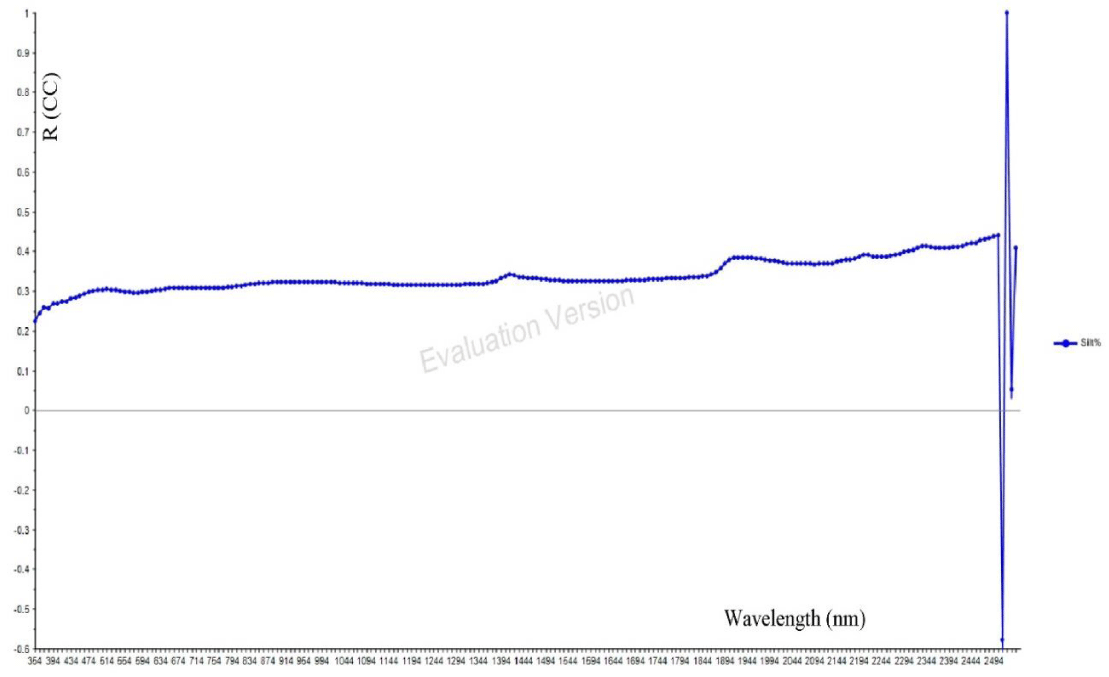
Also the correlation coefficients (R) of silt components with the effective spectral domains were calculated as: UV 390 nm= 0.27, Vis 680 nm=0.31, NIR 970-990 nm= 0.32, SWIR 1400-1410 nm= 0.34, 1910-1930 nm= 0.38, 2200-2210 nm= 0.39, 2340-2350 nm= 0.41 and 2430-2460 nm= 0.43. In which the specified spectral bands with the maximum of R contents indicate their high impacts as the independent predictors on the silt parameter modeling process in the studied soils of Mazandaran province (Figure 6). In an analogous manner, Cambule, et al. [33] stated the most influential spectral wavebands to study the soil parameters around 1.4, 1.9, and 2.2 micrometers. That is because of the presence of –OH groups of soil moisture as well as the moisture content in the crystal lattice of clay minerals. These findings were in agreement with the results of the present research work.
According to the model outputs in figure 3-O, P, Q, R and the correlogram in figure 6, the most influential hyperspectral domains involved in the modeling process of silt particles were determined as follows: Vis 440-580nm, NIR 890-990nm, SWIR 1620-1900 and 2240-2430nm which the results are consistent with an investigation by Curcio, et al. [22] to detect the spectral domains. They also expressed the spectral ranges of visible, NIR, and SWIR as the most effective optical domains in the study of soil textural constituents using the Continuum Removal Technique (CRT). As mentioned earlier based upon the process outputs, the model quality and power indicators (RPD & RPIQ) were calculated as: RPDc= 1.20, RPIQc= 1.71, RPDp= 1.02 and RPIQp= 1.14. In accord with the RPIQ values in the calibration subset (RPIQc), which were between 1.4-2, it can be concluded the models are able to estimate the silt content of Mazandaran soils moderately. It shows to some extent the acceptable quality of the predicting model utilizing the hyperspectral lab data in the study province. It is the low coefficient of variation and the statistical range of the silt content in the area beside the existing multi-modal status which caused to decrease in the model efficiency. In general, it can be concluded that the final silt model can present a moderate estimation throughout the Mazandaran province. In addition, few studies have been performed on the study of silt components using the hyperspectral reflected data indicating that silt predicting models are generally weaker than the other soil textural constituents. Bilgili, et al. [34] investigated silt components through the integration of spectroscopy and spectrostatistical approaches such as the PLS algorithm. So they were able to predict these soil components with R2c less than 0.5 and RPDc of about 1.36. That is indicating the moderate to the weak ability of the models in some studied soils. Similarly, the predictive model of silt fraction developed by Gomez, et al. [4] had a significant reduction in ability. All of these results were consistent with our findings. Although, Stenberg, et al. [30] were able to estimate this textural fraction with RMSE of about 7.4% and RPD around 1.6 indicating the model quality and strength were more acceptable.
Conclusion
During the present research, the investigation of spectral behaviors and signatures of soil silt components in northern Iran was done using the state of the art technology integrated with enhanced spectrostatistical analyses. In the end, it is highly recommended to utilize soil samples with a wider range of silt content to further boost and strengthen the model quality. In the current investigation, some obstacles such as confined statistical range, the multi-modal status of the silt content, and low variation coefficient prevented the proper and accurate calibration process. Hence samples with a wider range and variability of the soil components should be used. Finally, the findings detected and defined the spectral signatures and behaviors of the soil silt constituent. The influential spectral domains and wavebands involved in the modeling process were also specified based on the same methods. These results can be applied as a basis for measuring the silt content in Mazandaran soils in a faster and more cost-effective approach. Considering this matter, today the new generation of hyperspectral remote sensors with high spectral resolution perform the sensing of the environment, our results can be the starting point to accurately detecting and monitoring silt particles using the remote sensing platforms. However, more research needs to be done on the application of remotely sensed- or proximal-based spectroscopy for studying these important soil components. It is noteworthy that using this technique, the key wavelengths of the model can be detected. Hence the upscaling operation, as well as the construction of the new airborne/satellite hyperspectral sensors in the near future, are possible using the defined key wavelengths.
This research was partially supported by SANRU and TMU. We thank our colleagues from SANRU and TMU who provided insight and expertise that greatly assisted the research.
Data availability statement
The data that support the findings of this study are available from the corresponding author, upon reasonable request.
Permission to reproduce material from other sources
We authors, hereby exchange all copyright proprietorship to this journal that grants the right to the corresponding author to incorporate any necessary changes and he will act as the guarantor or surety for the manuscript on our behalf.
- Stefanidis S, Alexandridis V, Chatzichristaki C, Stefanidis P (2021) Assessing soil loss by water erosion in a typical mediterranean ecosystem of northern Greece under current and future rainfall erosivity. Water 13: 2002. Link: https://bit.ly/3rLNzM8
- Hateffard F, Mohammed S, Alsafadi K, Enaruvbe GO, Heidari A, et al. (2021) CMIP5 climate projections and RUSLE-based soil erosion assessment in the central part of Iran. Scientific Reports 11: 7273. Link: https://go.nature.com/3EHpxXO
- Stefanidis S, Alexandridis V, Ghosal K (2022) Assessment of Water-Induced Soil Erosion as a Threat to Natura 2000 Protected Areas in Crete Island, Greece. Sustainability 14: 2738. Link: https://bit.ly/3OAoq0n
- Gomez C, Le Bissonnais Y, Annabi M, Bahri H, Raclot D (2013) Laboratory Vis–NIR spectroscopy as an alternative method for estimating the soil aggregate stability indexes of Mediterranean soils. Geoderma 209-210: 86-97. Link: https://bit.ly/3L8a85b
- Ostovari Y, Ghorbani-Dashtaki S, Bahrami HA, Abbasi M, Dematte JAM, et al. (2018) Towards prediction of soil erodibility, SOM and CaCO 3 using laboratory Vis-NIR spectra: A case study in a semi-arid region of Iran. Geoderma 314: 102-112. Link: https://bit.ly/3xNuhtl
- Peng L, Cheng H, Wang LJ, Zhu D (2020) Comparisons the prediction results of soil properties based on fuzzy c-means clustering and expert knowledge from laboratory Vis-NIR spectroscopy data. Canadian J Soil Science 101: 33-44. Link: https://bit.ly/3vGtnfN
- Qi F, Zhang R, Liu X, Niu Y, Zhang H, et al. (2018) Soil particle size distribution characteristics of different land-use types in the Funiu mountainous region. Soil and Tillage Research 184: 45-51. Link: https://bit.ly/3k7za8u
- McDowell ML, Bruland GL, Deenik JL, Grunwald S, Knox NM (2012) Soil total carbon analysis in Hawaiian soils with visible, near-infrared and mid-infrared diffuse reflectance spectroscopy. Geoderma 189-190: 312-320. Link: https://bit.ly/3LhDUo0
- Danesh M, Bahrami HA, Darvishzadeh R, Noroozi AA (2016) Investigating clay contents using laboratory diffuse reflectance spectroscopy, Iranian Journal of RS&GIS 8: 71-94.
- Padarian J, Minasny B, McBratney AB (2019) Using deep learning to predict soil properties from regional spectral data. Geoderma Regional 16: e00198. Link: https://bit.ly/3LfaGX3
- Xu D, Ma W, Chen S, Jiang Q, He K, et al. (2018) Assessment of important soil properties related to Chinese Soil Taxonomy based on vis–NIR reflectance spectroscopy. Computers and Electronics in Agriculture 144: 1-8. Link: https://bit.ly/3Mqi4z1
- Xu S, Zhao Y, Wang M, Shi X (2018) Comparison of multivariate methods for estimating selected soil properties from intact soil cores of paddy fields by Vis–NIR spectroscopy. Geoderma 310: 29-43. Link: https://bit.ly/3MKYKwH
- Zhao L, Hong H, Fang Q, Algeo TJ, Wang C, et al. (2020) Potential of VNIR spectroscopy for prediction of clay mineralogy and magnetic properties, and its paleoclimatic application to two contrasting Quaternary soil deposits. Catena 184: 104239. Link: https://bit.ly/36JgI3d
- Adeline KRM, Gomez. C, Gorretta N, Roger JM (2017) Predictive ability of soil properties to spectral degradation from laboratory Vis-NIR spectroscopy data. Geoderma 288: 143-153. Link: https://bit.ly/3xQvn7G
- Askari MS, Cui J, O’Rourke SM, Holden NM (2015) Evaluation of soil structural quality using VIS–NIR spectra. Soil and Tillage Research 146: 108-117. Link: https://bit.ly/3vDGMFq
- Jong SMD, Addink EA, Van Beek LPH, Duijsings D (2011) Physical characterization, spectral response and remotely sensed mapping of Mediterranean soil surface crusts. Catena 86: 24-35. Link: https://bit.ly/3vDGRJe
- Bahrami A, Danesh M, Bahrami M (2022) Studying sand component of soil texture using the spectroscopic method. Infrared Physics & Technology 122: 104056. Link: https://bit.ly/3rO6JB4
- Matney T, Barrett LR, Dawadi MB, Maki D, Maxton C, Perry DS, et al. (2014) In situ shallow subsurface reflectance spectroscopy of archaeological soils and features: a case-study of two Native American settlement sites in Kansas. Journal of Archaeological Science 43: 315-324. Link: https://bit.ly/3KdEpy7
- Summers D, Lewis M, Ostendorf B, Chittleborough D (2011) Visible near-infrared reflectance spectroscopy as a predictive indicator of soil properties. Ecological Indicators 11: 123-131. Link: https://bit.ly/36Orgy4
- Stenberg B, Viscarra Rossel RA, Mouazen AM, Wetterlind J (2010) Visible and near infrared spectroscopy in soil science. Advances in Agronomy 107: 163-215. Link: https://bit.ly/3LcNnwU
- Pietrzykowski M, Chodak M (2014) Near infrared spectroscopy-A tool for chemical properties and organic matter assessment of afforested mine soils. Ecological Engineering 62: 115-122. Link: https://bit.ly/3vzEdE0
- Curcio D, Ciraolo G, D’Asaro F, Minacapilli M (2013) Prediction of soil texture distributions using VNIR-SWIR reflectance spectroscopy. Procedia Environmental Sciences 19: 494-503. Link: https://bit.ly/3LlBUeM
- Small C, Steckler M, Seeber L, Akhter SH, Goodbred S, et al. (2009) Spectroscopy of sediments in the Ganges–Brahmaputra delta: Spectral effects of moisture, grain size and lithology. Remote Sensing of Environment 113: 342-361. Link: https://bit.ly/3rQiJSj
- Rawlins BG, Kemp SJ, Milodowski AE (2011) Relationships between particle size distribution and VNIR reflectance spectra are weaker for soils formed from bedrock compared to transported parent materials. Geoderma 166: 84-91. Link: https://bit.ly/36OrbdK
- Kagan TP, Shachak M, Zaady E, Karnieli A (2014) A spectral soil quality index (SSQI) for characterizing soil function in areas of changed land use. Geoderma 230-231: 171-184. Link: https://bit.ly/3xR8n8H
- Camargo OA, Moniz AC, Jorge JA, Valadares JM (2009) Methods of Chemical, Mineralogical and Physical Analysis of Soils Used in the Pedology Section (Technical Bulletin n.106), Instituto Agronômico (IAC), Campinas. Link: https://bit.ly/3vFmw68
- Guo L, Zhang H, Shi T, Chen Y, Jiang Q, et al. (2019) Prediction of soil organic carbon stock by laboratory spectral data and airborne hyperspectral images. Geoderma 337: 32-41. Link: https://bit.ly/3LhDo9y
- Demattê JAM, Terra FS (2014) Spectral pedology: A new perspective on evaluation of soils along pedogenetic alterations. Geoderma 217-218: 190-200. Link: https://bit.ly/39gtxms
- Casa R, Castaldi F, Pascucci S, Palombo A, Pignatti S (2013) A comparison of sensor resolution and calibration strategies for soil texture estimation from hyperspectral remote sensing. Geoderma 197: 17-26. Link: https://bit.ly/3KhJXHY
- Sawut M, Ghulam A, Tiyip T, Zhang YJ, Ding JL, et al. (2014) Estimating soil sand content using thermal infrared spectra in arid lands. International Journal of Applied Earth Observation and Geoinformation 33: 203-210. Link: https://bit.ly/3vbKzKO
- Chang CW, Laird DA (2002) Near-infrared reflectance spectroscopy analysis of soil C and N. Soil Science 167: 110-116. Link: https://bit.ly/3MuxzGc
- Bellon-Maurel V, Fernandez-Ahumada E, Palagos B, Roger JM, McBratney A (2010) Critical review of chemometric indicators commonly used for assessing the quality of the prediction of soil attributes by NIR spectroscopy. Trends Anal Chem 29: 1073-1081. Link: https://bit.ly/3kaNcWZ
- Cambule AH, Rossiter DG, Stoorvogel JJ, Smaling EMA (2012) Building a near infrared spectral library for soil organic carbon estimation in the Limpopo National Park, Mozambique. Geoderma 183-184: 41-48. Link: https://bit.ly/3EGEf1f
- Bilgili AV, Van Es HM, Akbas F, Durak A, Hively WD (2010) Visible-near infrared reflectance spectroscopy for assessment of soil properties in a semi-arid area of Turkey. Journal of Arid Environments 74: 229-238. Link: https://bit.ly/3LiiQhs
Article Alerts
Subscribe to our articles alerts and stay tuned.
 This work is licensed under a Creative Commons Attribution 4.0 International License.
.gif)
.gif)


 Save to Mendeley
