Journal of Civil Engineering and Environmental Sciences
Study of Lead (Pb) Distribution in Soil of Jetis District, Mojokerto Regency
Ananda Alfan Maulana1*, Bieby Voijant Tangahu1, Anak Agung Gde Kartika2 and Kriyo Sambodho3
2Department of Civil Engineering, Faculty of Civil, Environment and Geo Engineering, Sepuluh Nopember Institute of Technology, 60111, Indonesia
3Department of Oceanic Engineering, Faculty of Marine Engineering, Sepuluh Nopember Institute of Technology, 60111, Indonesia
Cite this as
Maulana AA, Tangahu BV, Gde Kartika AA, Sambodho K (2019) Study of Lead (Pb) Distribution in Soil of Jetis District, Mojokerto Regency. J Civil Eng Environ Sci 5(2): 005-012. DOI: 10.17352/2455-488X.000032The increase in the percentage of land pollution in rural areas in East Java Province in 2011 to 2014 was caused by various factors. One of the factors that led to an increase in the percentage of land pollution was the increase in industrial activities in rural areas which made population growth and activity also increase. Jetis District is one of the densely populated areas of industrial activity where there are ±5 large factories with dense industrial activities. Previous research stated that a village well water in the jetis sub-district, Lakardowo village had concentrations of heavy metals Pb, Fe, and Mn which exceeded the quality standard. The three metals included in the heavy metal group and have a high toxic effect are Pb metal. Pb metal is fairly universal in terms of its sources because it can be found from various sources such as the metal coating industry, steel industry, electricity industry, B3 waste storage industry, motorized vehicle gas emissions, and domestic activities of citizens. Geographic Information System (GIS) is used to create a map of chrome distribution so that the determination of the remediation method can be more targeted. To make a map of the distribution of Pb Metal, data on Pb Metal concentrations are needed in all areas of Jetis District. Using the transect method, sample points will be found with each distance of 1km×1km. Then using the Ring Sampling will find soil at a depth of 0-20cm to be sampled. Soil samples taken were then extracted using the wet digestion method and EDTA extraction. The concentration of chrome metal in the liquid sample was then measured by the Atomic Absorp Spectrophotometry (AAS) method. Analysis of the distribution of Metal Pb using ArcGis. 63 sample points were obtained with the lowest concentration at 7,15mg/Kg and the highest concentration obtained at 80,95mg/Kg.
Introduction
Land pollution in rural areas in East Java increased from 2011 to 2014. Data from the Indonesian Environmental Statistics in 2017 regarding village land pollution shows that in 2011 the percentage of villages that experienced land pollution was 1.19%. In 2014 the percentage of land pollution in that village area increased to 1.22% [1].
Soil pollution is the process of living things, substances, and energy or other components entering or infiltrating into the soil and/or changes in the composition of soil due to human activies or natural processes, so that the quality of the soil degrades to a certain level, which causes the soil to become less or no longer functioning according to its use. Substances, energy, or other components in question can come from many sources including human activities, transportation, industrial waste, mining waste, fertilizer and pesticide residues, to former chemical weapons installations. Some of these sources will contaminate the soil and form dangerous chemical substances.
Heavy metal contamination is one example of hazardous chemical substances that can form in the soil. The spread of heavy metal contamination in soil and ground water can be through the intermediaries such as water, wind, absorption by plants, and bioaccumulation in the food chain [2]. Heavy metals that can contaminate soil include Hg, Cd, Ag, Ni, Pb, As, Cr, Sn, and Zn [3]. Of the nine types of heavy metals, several heavy metals are classified to have high toxicity, namely Hg, Cd, Pb, As, Cu and Zn [4].
Previous research had been carried out in Jetis District, explaining that ground water in the well of one of the residents in a village in Jetis District contained Pb metal concentration that exceeded the standard quality [5]. Pb metals that exceed these quality standards are indicated to have come from waste from one of the hazardous waste processing industries in Jetis District.
According to Brass and Strauss [6], Pb metal is a heavy metal that is carcinogenic and takes a long time to decompose. Also, according to Erfandy and Juarsah [7], Pb metal is an inorganic material that can easily pollute the soil for a long time. Pb metal can come from various sources. As stated by Faust adn Aly [8], Pb metal can naturally be found in the form of lead sulfide (PbS), lead carbonate (PbCO3), lead sulfate (PbSO4), and lead chlorophosphate. In agriculture, 10% of the composition of pesticides used contains Pb metal [9]. Pb metal is mostly found from the combustion of fuel and other additives from motor vehicles in the form of inorganic Pb emissions that come out simultaneously with other heavy metals such as Hg, Cd, As, and Cr, which come out into the air and then settle on the ground surface [10]. Pb metal can also come from specific sources in the form of hazardous waste which generally comes from the rest of industrial activities [11].
Pb metal from various sources will accumulate in certain media such as soil, water and air [12]. Soil media, or more specifically the surface layer of the soil, is a media that receives a variety of pollutants, especially pollutants from heavy metal contamination which will later be used as a reference to measure environmental quality [13].
Therefore, it is necessary to do a study of the distribution of Pb metal concentration in soil by using GIS (Geographic Information System) technology in order to make maps of the distribution of Pb metal concentration in Jetis District. From the distribution map, it is can be determine which areas of Jetis District have Pb metal concentration values that exceed or do not exceed the quality standard.
Overview of Study Area
Regional profile of Jetis District
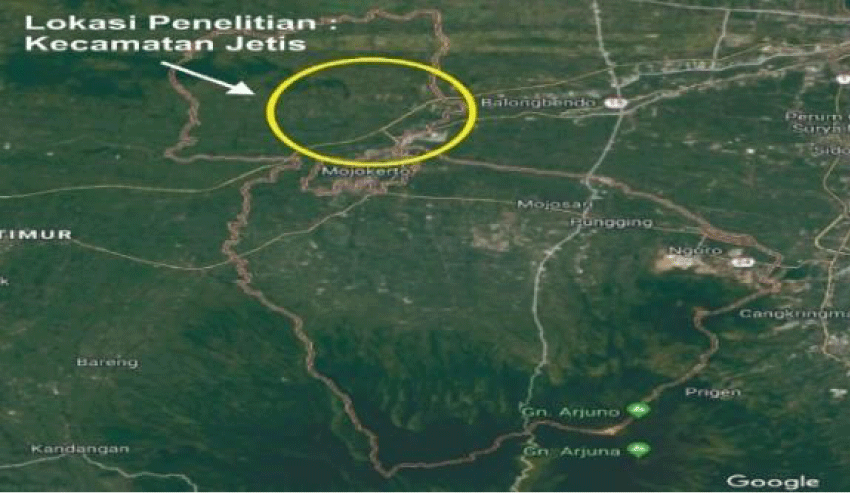
Jetis District is located in Mojoketo Regency. Jetis District is one of 18 (eighteen) districts located in Mojokerto Regency, East Java Province. Jetis District is located about 10 km to the north of the Mojokerto Regency Government Center. Jetis District has an area of 56.82km2, has a population of 79,967 people, has a population density of 1,224 person/km2 with a population growth rate of 1.67%. Jetis District consists of 16 villages, 126 Rukun Warga (RW), and 485 Rukun Tetangga (RT). Figure 1 shows the location of Jetis District in Mojokerto Regency [14].
Regional border of Jetis District
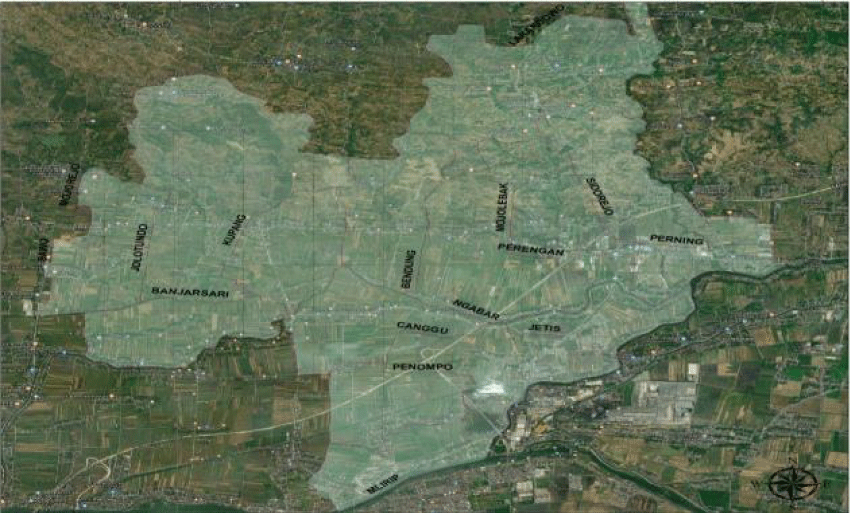
Jetis District with its administrative area is considered to be large district. Jetis District has an administrative area which has borders on every side of its territory. The large area results in Jetis District immediately bordering with other regencies/cities around the area of Mojokerto Regency. In the north, Jetis District is bordered by Dawar Blondong District, which is also a district in Mojokerto Regency. In the east, Jetis District is bordered by Gresik Regency and Sidoarjo Regency. In the south, Jetis District is bordered by Mojokerto City. West of Jetis District is bordered by Gedeg District which is also a district in Mojokerto Regency [14]. In Figure 2 a map of the Jetis District area is shown.
Industrial activities of Jetis District
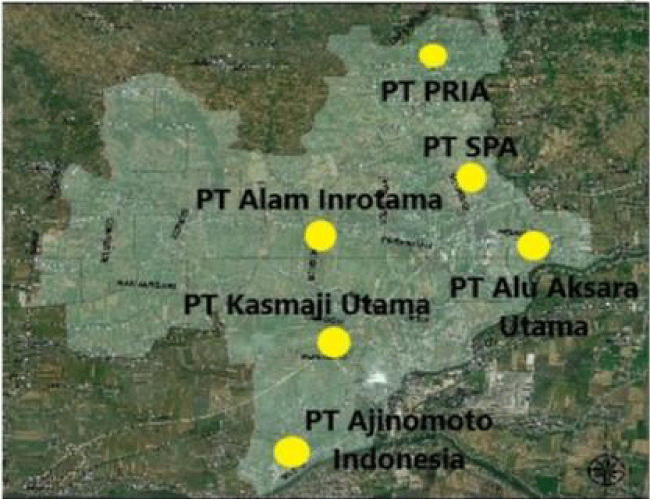
The basis for selecting Jetis District in conducting a Pb metal distribution study is the diversity of industrial activities found in this district. The industrial activities carried out in Jetis District are industrial activities that carry out large-scale production and as well as several industries carrying out small-scale production. Recorded in detail, the types of industrial activities found in Jetis District include 3 food and beverage industries, 1 textile industry, 1 leather goods industry, 3 pharmaceutical chemical industries, 5 rubber industries, 3 non-metal quarry industries, 3 basic metal industries, 2 electronic industries, and 8 furniture industries [1]. Figure 3 shows the location of industrial activities in Jetis District.
Research Methodology
Time and place of study
The study was conducted from February to June 2019. Sample collection was conducted in Jetis District, Mojokerto Regency. Laboratory analysis was conducted at the Environmental and Chemical Engineering Laboratory, Universiti Kebangsaan Malaysia (UKM), Bangi, Selangor, Malaysia. The study and journal composition were conducted at the Department of Environmental Engineering, FTSLK, Institut Teknologi Sepuluh November (ITS) Surabaya.
Tools and material prepsration
To conduct this study, several tools and materials are needed to achieve the desired results. Tools that must be prepared include shovel, ruler, soil sample ring, plastic soil sample container, analytical balance, erlenmeyer flask, pipette, measuring cup, 50 ml sample bottle, rotary shaker, centrifuge, filter paper, vacuum pump, fume hot block engine, atomic absorp spectrophotometry machine, and computer equipped with AutoCAD and ArcGIS software (ArcMap 10.3).
Materials that are prepared include Jetis District soil samples, EDTANa2 extraction solution and Aqua Regia extraction solution.
Sample collection
In collecting samples for this study, there are several stages, including determining the location of the sample to be taken and collecting the soil sample at the specified location.
Determination of sampling points
The location of the sample points in this study were determined using the transect area method. According to Hidayat, et al., [15], the transect area is the use of a line or lane with a specified area that is placed as a whole in the region or region to be sampled. The coverage of the transect area is determined based on the area of the region to be sampled [16]. With an area of 57.10km2 the dimension of the transect area will be determined at 1km×1mm. The transect area will be plotted thoroughly in the Jetis District area using ArcGIS software (ArcMap 10.3) which will produce a map of the Jetis District area with a transect area of 1km×1km.
Sample extraction
From each sample location points formed from the process of the transect area method, soil samples will be taken at each sampling location. The sampling process uses the ring sample method. Ring sample is sampling using a ring soil sampling tool with a length of ±20cm which aims to obtain soil samples to be analyzed in a laboratory [17].
The process of sampling starts from flattening and then cleaning the soil surface from grass or litter. Afterwards, the soil is dug to a certain depth (10cm-20cm) using a small shovel around the spot to place the sampling ring device, then placing the sampling ring perpendicular to the ground surface which will then be pressed using a small beam so that the ring tool appears to enter the ground evenly. After that, the sampling ring tool that has entered the ground surface is dug out using a shovel. Finally, the soil collected inside the sampling ring is moved into a ziplock plastic container. Soil samples in the ziplock plastic are ready to use.
Sample preparation
After sampling, the next step in the study is to prepare the sample before a laboratory analysis is performed. The stages of sample preparation in this study are the extraction of soil samples. 2 (two) extraction methods will be carried out, namely the extraction method with EDTANa2 solution [18] and acid digestion extraction method (Wet Digestion) with Aqua Regia solution [19].
EDTANa2 extraction method
The purpose of the EDTANa2 extraction method is to find out the bioavailability value (concentrations that are readily available and easily absorbed) of Pb metal in soil samples [18].
The process of EDTANa2 extraction starts by weighing EDTANa2 powder as much as 18.61 grams±0.05grams, then dissolving it with 800ml±20ml of nyah-ion distilled water. This is followed by adding 10mol/L of NaOH solution to the EDTANa2 until the pH of EDTANa2 solution is 8, then optimizing the EDTANa2 solution by adding up to 1000ml of nyah ion distilled water. After that, 5 grams of soil sample is weighed and put into a 50ml centrifuge bottle, then the soil sample is dissolved with 50ml EDTANa2 solution. Next, shake the soil sample that has been dissolved with EDTANa2 solution in a centrifuge bottle using a rotary shaker at a speed of 30rpm for ±1 hour. This is followed by inserting a shaken soil sample into a centrifuge at 4000rpm for ±10 minutes. After that, the soil sample that has been removed from the centrifuge machine is filtered out using a 0.45µm filter paper with the help of a vacuum pump machine. After filtering the sample, the sample is stored in a refrigerator at ±4°C to be analyzed later [18].
Wet digestion
Acid-digestion or Wet-Digestion extraction aims to determine the value of total Pb metal concentrations contained in soil samples [18]. This extraction method uses Aqua Regia acid solution. Aqua Regia is a solution made from mixing strong concentrated hydrochloric acid (HCl) and concentrated nitric acid (HNO3) in a ratio of 3:1 [20].
The process of extraction by acid digestion (Wet-Digestion) starts from weighing a soil sample of 2grams, then adding 5ml of 69% HNO3 to a soil sample that has been placed in a measuring tube. The measuring tube is then placed in a Fume Hot Block machine which is then allowed to stand for ±1 night. After 1 night, the next step is heating the sample for ±1.5 hours at 95°C with a Fume Hot Block machine. Next, the sample is cooled to a temperature of 80°C, then 1-2ml H2O2 30% is added to the sample after which it is reheated for ±2 hours at 95°C. After heating, 2.5ml of Aqua Regia solution (HNO3: HCl=1:3) is added, then the sample is optimized by adding 50ml of nyah-ion distilled water. After optimizing the sample, the final step is to filter the sample using 0.45 µm filter paper with the help of a vacuum pump machine. After filtering the sample, then storing the sample in a refrigerator at ±4°C before the further analysis [18].
Sample analysis
After the extraction process is complete, the extracted samples are ready to be used as further laboratory analysis. The sample analysis method used in this study is using the AAS (Atomic Absorp Spectrophotometry) measurement method. The AAS machine measurement method is a measurement method commonly used to determine the concentration of heavy metals. The AAS analysis method is a quantitative elemental analysis method based on the absorption of light by metal atoms in a free state with a predetermined wavelength [21]. According to the Indonesian National Standard (SNI), for measurement of Pb metal concentration the wavelength used is 217nm [22].
The working principle of the AAS analysis is to change the extracted liquid sample into a form of gas that will enter a flame and become an atom in a groundstate. The light from the AAS engine cathode lamp whose wavelength has been determined (wavelength for the measurement of Pb metal is 217nm) will then be passed with atoms in the flame so that the excitation of the atomic molecules. The absorption that occurs from the excitation process has a value proportional to the number of groundstate atoms that are in the flame. Rays that are not absorbed or not excited will be transmitted to the detector which will be converted into a measured beam. The measured beam is recorded as absorbance unit value (A) which will then be plotted on a calibration curve to find the Pb metal concentration value in unit values mg/L or ppm (part per million) [23].
Construction of lead distribution map
After the sample analysis is complete, a map of the distribution of Pb metal concentrations using GIS (Geographic Information System) technology will be made with the use of ArcGIS software (ArcMap 10.3). GIS (Geographic Information System) is a feature that is compiled into a system for organizing, analyzing, and displaying geographic information [24].
The distribution map of Pb metal concentration is based on the AAS analysis results of Pb metal concentration in each sample analyzed. The Pb metal concentration distribution map will later use a color indicator as a large marker of the Pb metal concentration value in the respective area. The more concentrated the color on the map, the greater the concentration of Pb metal contained in the area. The distribution map of Pb metal concentration can later show which areas in Jetis District have Pb metal concentration values above or below the specified quality standard.
Results and Discussion
In this study, the results will be issued in the form of a map of the distribution of Pb metal concentrations and geographical analysis of the map. The analysis described later is the value of the largest and smallest Pb metals located in the Jetis District area. An indication of the source of Pb metal contamination in the area will also be given an explanation. To make a map of the distribution of Pb metal concentrations, several stages will be carried out, which will be explained as follows.
Transect Map of 1km×1km
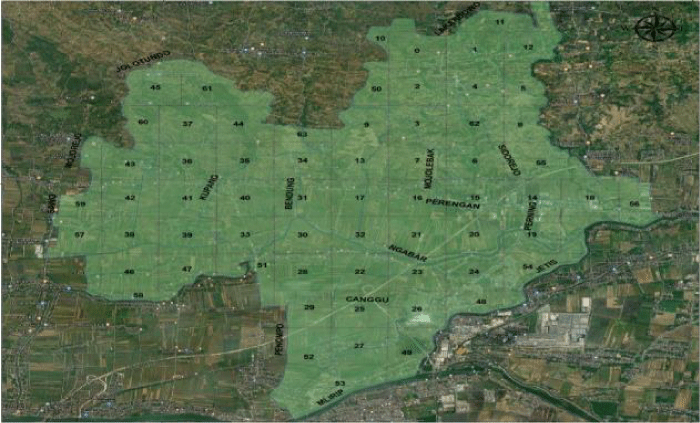
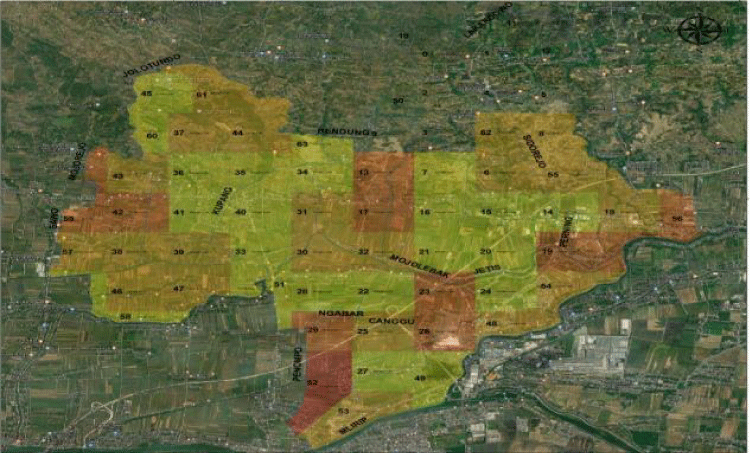
1km×1km transect area map was created using the ArcGIS software (ArcMap 10.3). This transect map aims to determine the scope of the region at the point of sampling location in Jetis District. In Figure 4, a Jetis District Map with a transect of 1km×1km is shown.
From this map there are 63 (sixty three) transect boxes which will be used as the coverage area of the sampling location. But constrained by licensing issues, samples are not allowed to be collected in 10 (ten) transect boxes located in Lakardowo Village. Therefore, the total sample location points that must be taken are as many as 53 (fifty three) sample location points.
Sample collection
Sampling will be conducted for all 53 (fifty three) sample locations. Sampling is done when the weather is sunny and there is no rain or drizzle. The sampling process starts by selecting the point of sampling location based on 1km×1km transect map. The choice of location points is for adjusting sample location points on the existing transect map so that no sample location points are in the same transect box. To facilitate the adjustment, software applications is used on the mobile phone, which are Google Maps and UTM Geo Maps. The Google Maps application is used to determine the route that must be taken to reach the sampling location point, while the UTM Geo Maps application is used to adjust the sampling point location within the coverage of the transect box and does not enter into other transect box areas.
After getting the corresponding sampling location, the next step is to take the sample using the ring sampling device. The sampling ring device has dimensions of 20cm in height and diameter of 12cm. The ring sampling device used is made of iron. Soil at the point of sampling location is taken using the sampling ring. The soil that is in the ring device is then transferred to the plastic ziplock so that the soil is not scattered. The two stages that have been described are done in each od the 53 (fifty-three) points of the sample locations.
Sample extraction and AAS analysis results
The 53 (fifty-three) samples that have been taken will then continue to be extracted and also analyzed using the AAS (Atomic Absorp Spectrophotometry) machine. Sample extraction was carried out using 2 (two) extraction methods, namely EDTANa2 extraction method and acid-digestion extraction method (Wet-Digestion) with Aqua Regia solution. For each extraction method, the sample that will be extracted will be replicated to 3 (three) replications. The number of samples for each extraction method is 159 (one hundred fifty-nine) samples for one extraction method, and the total number of samples for both extraction methods is 318 (three hundred eighteen) samples. Sample replication is done in order to accurately read the analysis of the extraction results with the AAS machine, from which the average value (mean) will be taken of 3 (three) replications in the AAS analysis reading.
The EDTANa2 extraction method uses EDTANa2 solution in its extraction. It was explained in Aziz, et al., [25], that EDTANa2 solution is a solution that acts as a chelating agent and is capable of binding Pb metal. The purpose of this extraction method is to obtain the bioavailability value of Pb metal contained in the soil sample. Bioavailability value is the concentration value of heavy metals that are available and can be absorbed by living things that can show toxic responses [26]. The working principle of this EDTANa2 is the binding of Pb metal by the EDTANa2 solution through the process of shaking and separating the dissolved and non-dissolved substances using a centrifuge, and the filtering process with filter paper using a vacuum pump [27].
The Wet-Digestion extraction method uses a strong acid solution that is the Aqua Regia solution in its extraction. According to Sumardi [28], it was explained that the Aqua Regia solution is a mixture of strong acid which is concentrated hydrochloric acid (HCl) and concentrated nitric acid (HNO3) with a ratio of 3:1 that is able to dissolve Pb metal. The purpose of the acid digestion (Wet-Digestion) extraction method is to obtain the total value of Pb metal concentrations in soil samples [29]. The total value of Pb metal concentration has included the value of bioavailability concentration in theory, so the total value of Pb metal concentration is greater than the value of the concentration of bioavailability but the relationship value of the two extraction methods is not always directly proportional [30]. The working principle of this wet-digestion extraction method is the digestion of Aqua Regia’s solution by soil samples which are bound by the solution and also the heating process using a Fume Hot Block machine as well as filtering the sample similar to the EDTANa2 extraction method using filter paper with a machine vacuum pump [19].
After the sample extraction is complete, the extracted sample will then be analyzed for the Pb metal concentration values contained in the sample using an AAS (Atomic Absorp Spectrophotometry) machine. The results of the AAS analysis will produce a concentration value in units of ppm (part per million) or mg/L. Because this analyzed sample is a soil sample having a certain mass in each extraction method, a conversion of the unit value of mg/L to unit value of mg/kg is carried out. Unit value conversion can be done using the following formula:
As an example of calculation, in sample number 6 (six) the results of the AAS analysis for the extraction of EDTANa2 (bioconcentration value) is 1.55mg/L and for the wet-digestion is 1.59mg/L. The following will be calculated for the conversion of the concentration values of the two extraction methods:
EDTANa2 extraction Method
Wet digestion
The following table 1 will show the complete results of the AAS analysis of the two extraction methods that have been converted for all soil samples.
From the table above there are 4 (four) soil samples, namely sample number 7, 14, 15, and 63 which have a bioavailability value greater than the total concentration value. This is caused by several factors such as human error and poor sample conditions during extraction.
Data of total concentration values obtained from wet-digestion extraction method will be used as a reference for Pb metal concentration data for making maps of Pb metal concentration distribution in Jetis District.
Analysis of the pb metal distribution concentration map
The distribution map of Pb metal concentrations was made using ArcGIS software (ArcMap 10.3) based on the results of the AAS analysis of the total Pb metal concentration values from the results of acid-digestion extraction (Wet-Digestion). Pb metal concentration values on the distribution map will be illustrated using a color density indicator. The more concentrated the color, the higher the Pb metal concentration value in the region and vice versa, the more faded the color, the lower the Pb metal concentration in the region. Figure 5 shows the map of the distribution of Pb metal concentrations in Jetis District.
Based on the map above, there are several sample location points that are not color-coded, namely sample points 0, 1, 2, 3, 4, 5, 9, 10, 11, 12, and 50. The sample points are not colored because sampling are not done in those points due to licensing issues.
The sample point that are given a yellow indicator has a Pb metal concentration value in the range of 0-20mg/kg. The sample points are number 7, 14, 15, 16, 20, 21, 22, 24, 27, 28, 33, 34, 35, 36, 40, 41, 45, 49, 51, 58, and 60. Judging from the land use by BAPPEDA of Mojokerto Regency, this yellow sample point area is a deforested area far from residential areas. Bare paddy land contains more elements of N (nitrogen) due to the deforested paddy land there is no more rice production process, in other words there is no use of pesticides which would be a source of Pb metal concentration in the soil and what remains are only nutrients in the deforested rice fields [31].
Next, the sample points which with the light orange indicator has a Pb metal concentration value in the range of 20-40mg/kg. The sample points are sample point numbers 6, 8, 18, 25, 30, 31, 32, 37, 38, 39, 43, 44, 46, 47, 48, 53, 54, 55, 57, 61, and 62. In the land use arrangement by BAPPEDA of Mojokerto Regency, the area of the sample points are mostly green rice fields and areas crossed by highways. According to Gusnita [32], it was explained that the source of the accumulation of Pb metal in the soil could come from green rice fields. This is because the green rice fields are paddy fields that are still in active production and can still absorb Pb metals in the area around the rice fields.
Furthermore, sample points that are given a bright orange indicator have a Pb metal concentration value in the range of 40-60mg/kg. The sample points are sample point numbers 13, 17, 19, 23, 26, 29, 42, 56, and 59. Reviewing the land use by BAPPEDA Mojokerto Regency, the sample point area is a productive paddy area which is directly adjoining to a dense settlement population. The use of pesticides for productive paddy fields is a major factor in the source of Pb concentration in the soil. According to Jones and Jarvis [9], it was explained that 10% of the Pb metal is contained in the composition of pesticides.
Finally, sample points that are given a solid orange to red indicator have a Pb concentration value of more than 60 mg/kg. The sample point is number 52 only. In the land use arrangement by BAPPEDA of Mojokerto Regency, that sample point area is a densely populated settlement adjoining a large industrial area and some surrounded by productive rice fields. Industrial areas are the main source of Pb concentration in the soil with all the industrial activities that can cause Pb waste. According to [33-35], smoke originating from factory chimneys in the gas phase as well as residents’ domestic activity waste are factors in the source of Pb metals in the soil. Pb metals originating from the domestic activities of the residents are mostly in liquid form originating from waste water of bathing, washing, and toilet activities.
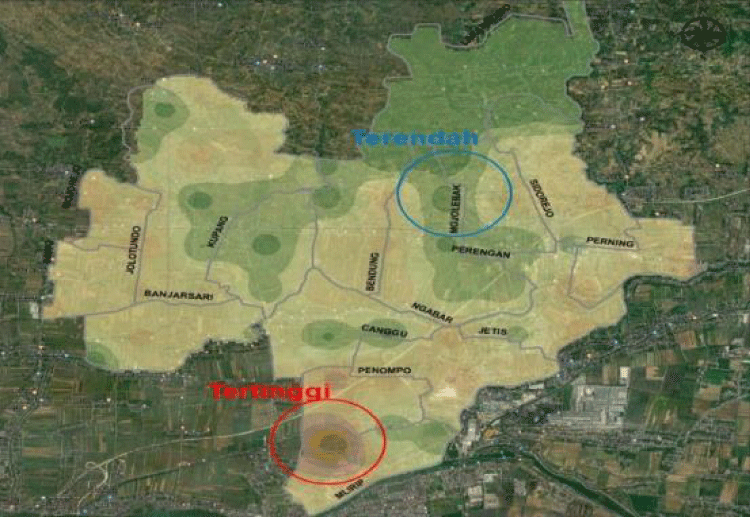
Based on the analysis of the distribution map and the table of Pb metal concentration values, the lowest Pb metal concentration values were 7.15mg/kg which was in the range of 0-20mg/kg and located in the Mojolebak Village. The highest Pb metal concentration value is 80.95mg/kg which is >60mg/kg and is located in Penompo Village. In Figure 6, an iso-centric Pb metal distribution map in the Jetis District is shown.
The next step is analysis of the quality standard of Pb metal in the soil. This analysis aims to determine whether the Pb metal concentration in Jetis District can be stated to pollute the soil which is indicated by numbers exceeding the quality standard, or if the Pb metal concentration in Jetis District is still below the quality standard and cannot be said to be polluting the soil.
Analysis of Pb metal quality standards in soil
The Pb metal quality standard used in this study is the quality standard for heavy metal content in the soil according to Government Regulation Number 101 of 2014 concerning the Management of Hazardous Waste. The following table 2 displays the quality standards for heavy metals in the soil.
Seen in the table above, the Pb metal quality standard at concentration level A(TK-A), the maximum value of Pb metal in the soil is 6000mg/kg. At the level of concentration B(TK-B), the maximum value of Pb metal in the soil is 1500mg/kg and at the level of concentration C(TK-C), the maximum value of Pb metal in the soil is 300mg/kg.
If the Pb metal concentration in Jetis District exceeds TK-A quality standard, category B3 waste must be treated. If Pb metal concentration exceeds TK-B quality standard but less than TK-A quality standard, category 2 B3 waste must be treated. If the Pb metal concentration exceeds the TK-C quality standard but is less than the TK-B quality standard, then non-B3 waste is treated. If the Pb metal concentration is less than TK-C, the soil contained in the Pb metal can still be used as a subgrade or can be said to have not polluted the surrounding soil.
Based on the results of the distribution map analysis and the Pb metal concentration values, the highest Pb metal concentration values were 80.95mg/kg. Referring to the value and information of the Pb metal quality standard in soil in table 2, the highest Pb metal concentration value is still below the TK-C value of 300mg/kg. Therefore, the soil in Jetis District is not contaminated with Pb and can be used as a subsoil layer.
Conculusion
The highest Pb metal concentration value was obtained at 80.95mg/kg at sample point number 52 located in Penompo Village, while the lowest concentration value was 7.15mg/kg at sample point number 7 located at Mojolebak Village. The highest concentration value is still below the TK-C quality standard, in other words the soil in the Jetis District is not contaminated with Pb and can be used as a subsoil layer.
- Badan Pusat Statistik (2017) Mojokerto District in Numbers 2017. Mojokerto.
- Chaney RL, Angle JS, Baker AJM, Li YM (1998) Method for Phytomining of Nickel, Cobalt, and Other Metals from Soil. US Patent 5: 711-784.
- Notohadiprawiro T (1993) Heavy Metals in Agriculture Seminar in PPKS, Medan 28 Agustus 1993. Yogyakarta: reprodued by Soil Science Study Programe UGM.
- Connel DW, Miller GJ (1995) Chemistry and Polution Ecotoxicology. Translated by Koestoer S, Jakarta:UI-Press 419.
- Laila P (2017) Study of Soil Water Pollution and Its Impact in Society. Public Health Faculty. Unair: Surabaya.
- Brass GM, Strauss W (1981) Air Pollution Control. New York:John Willey and Sons.
- Erfandy D, Juarsah I (2014) Soil Conservation to Faces Climate Change. Balitbang (Soil Research Center).
- Faust SD, Aly OM (1981) Chemistry of Natural Waters. Michigan:Ann Arbor Science Publishers, Inc 399.
- Jones LHP, Jarvis SC (1981) The Fate of Heavy Metals. DJ Green and MHB Hayes (Eds.). in The Chemistry of Soil Processes New York :John Wiley & Sons 593.
- Sudarmaji J, Corie M (2006) Hazardous Heavy Metal Toxicology and Its Impact for Health. Environmental Health Journal 2: 129-142.
- Republic of Indonesia Government Regulation No.18/1999 concerning Management of Hazardous and Toxic Wastes.
- Artant MR, Nursyamsi D (2010) Identification of Pb Heavy Metal Pollution in Rice Fields in Solo Hilir Wateshed, Bojonegoro Regency. Proceedinngs of The National Seminar on Land Resources Innovation and Workshop.Book 1. Policy and Information on Land and Environmental Resources. Center for Research and Development of Agricultural Land Resources. Land Researh Center. Agricultural Ministry.
- Lasat MM (2000) Phytoextraction of Metals from Contaminated Soil : A Review of Plant/Soil/Metal Interaction and Assesment of Pertient Agronomic Issues. 5. Link: http://bit.ly/2snPuuf
- Badan Pusat Statistik (2017) Indonesian Statistic of Environment 2017. Jakarta.
- Hidayat M, Laiyanah, Nanda S, Yenni AP, Nurul M (2017) Plant Vegetation Analysis Using Line Transect in Seulawah Agam Forest Pula Kemukiman Lamteuba Village Aceh Besar District. Biotic National Seminare Proceeding 2017. Biology Science Study Programe FTK UIN Ar-Raniry Banda Aceh.
- Nurrahman YA, Otong SD, Rita R (2012) Structure and Composition of Mangrove Vegetation in The Coastal District of Sungai Raya Kepulauan Bengkayang Regency, West Kalimantan. Fisheries and Marine Journal 3: 99-107.
- Suganda H, Sutono AR (2006) Book of Soil Physical Properties and Methods of Analysis. Agricultural Department Research Center. Jakarta
- Holleman AF, Wiberg E, Wiberg N (2001) Inorganic Chemistry. Germany. Link: http://bit.ly/37NbBuB
- US.EPA (1996) Clean Water Act. sec. 503 (U.S. Environmental Protection Agency Washington, D.C) 58.
- American Chemical Society (2010) Aqua Regia.
- Skoog DA, Holler FJ, Nieman AT (1998) Principles of Instrumental Analysis. 5th ed. USA Saunders College Publishing.
- SNI 6989.8 (2009) Water and Waste Section 8 : Test Method of lead (Pb) by Atomic Absorption Spectrophotometry (SSA)-Light
- Aprilia D, Dwi R, Dwi RAK (2015) Atomic Absorption Spectrophotometry Papers. Pharmacy Study Programe Pharmacy Faculty Bhakti Wiyata Institute of Health Science. Kediri : Bhakti Wiyata Institute of Health Science.
- ESRI (2004) GIS by ESRI (Environment Science & Research Institute). California: ESRI Inc.
- Aziz TR, Amalia P, Devah V (2010) Removal of Heavy Metals from The Ground Using Chelating Agent (EDTA). Palembang: Sriwijaya University.
- Widianingrum, Miskiyah, Suismono (2007) Dangers of Heavy Metal Contamination in Vegetables and Alternative Prevention : Agriculture Postharvest Technology Bulletin. Center for Postharvest Agriculture Research and Development 3: 16-27.
- Quevauviller PH (1998) Methodologies In Soil and Sediment Fraction Studies, Single and Squiental Extraction Procedures. Royal Society of Chemistry. United Kingdom.
- Sumardi (1981) Sample Destructin Methods by Atomic Absorption Spectrophotometry in Eleent Analysis. National Seminar Proceeding of Analysis Methods. LIPI.
- Raimon (1993) Comparison of Wet and Dry Destruction Methods by Atomic Absorption Spectrophotometry. Nationa Workshop on The Indonesian Analytical Chemistry Cooperation Network. Yogyakarta.
- Damanik M, Madjid B (2010) Soil Fertitlity and Fertilization. Medan: USU Press.
- Kurnia U, Suganda H, Saraswati RN (2009) Rice Field Pollution Controling Technology. The Land Department Research Center.
- Gusnita D (2012) Heavy Metal Leads (Pb) Pollution in The Air and The Efforts to Eliminate Leaded Gasoline. Dirgantara News 13: 93-101.
- McLaren RG, Clucas LM, Taylor MD (2004) Leaching of Macronutrients and Metals from Undisturbed Soils Treated with Metal-Spiked Sewage Sludge : Distribution of Residual Metals. Australian Journal of Soil Research 43: 159-170. Link: http://bit.ly/34DV2z6
- Decree of State Minister of Population and Environment Number 2 of 1998 concerning Guidelines for Determination of Environmental Quality Standards.
- John DA, Leventhal JS (1995) Bioavailablity of Metals. In Edward A. Du Bray (Ed.), Preliminary Compilation of Descriptive Geoenvironmental Mineral Deposit Models. U.S Department of Interior, U.S Geological. Denver, Colorado.
Article Alerts
Subscribe to our articles alerts and stay tuned.
 This work is licensed under a Creative Commons Attribution 4.0 International License.
 Save to Mendeley
