Journal of Civil Engineering and Environmental Sciences
Land Use Change and Forest Fragmentation Analysis: A Geoinformatics Approach on Chunati Wildlife Sanctuary, Bangladesh
Md Farhadur Rahman1, Mohammed Jashimuddin1, Kamrul Islam1* and Tapan Kumar Nath1,2
2School of Biosciences, University of Nottingham Malaysia Campus, Semenyih, Malaysia
Cite this as
Rahman MF, Jashimuddin M, Kamrul Islam, Kumar Nath T (2016) Land Use Change and Forest Fragmentation Analysis: A Geoinformatics Approach on Chunati Wildlife Sanctuary, Bangladesh. J Civil Eng Environ Sci 2(1): 020-029. DOI: 10.17352/2455-488X.000010Geoinformatics approach is increasingly used to monitor land use change as well as forest fragmentation due to availability of Landsat satellite data. In Bangladesh many initiatives have been taken to prepare land use maps but forest fragmentation modelling is quite new. In this research, geoinformatics approach is thoroughly used to determine land use changes of Chunati Wildlife Sanctuary from 2005 to 2015. Three time frame data sets i.e. 2005, 2010 and 2015 were used for assessing forest fragmentation. Forest intactness is measured by the proportion of four spatial patterns i.e. core, perforated, edge and patches. Previously tree cover and density was considered as the yardstick to measure forest health and ecosystem but recent studies regarding forest fragmentation have uncovered many harmful impacts of it. However, in this research authors observed 26.44% decrease in forest cover, 37.56% decrease in water bodies and 56.05% increase in cropland, 42.52% increase in barren lands, 69.01% increase in afforested area in between 2005 and 2010. Overall condition was leading to substantial forest fragmentation. Due to initiation of restoration activities positive results have come out which are 18.86% and 38.01% decrease in cropland and barren land respectively accompanied by 58.92% increase in forest between 2010 and 2015. As forest fragmentation is highly correlated with conversion of forest into non forest uses, core areas and perforated areas significantly reduced to 503 hectares and 1212 hectares respectively in between 2005 and 2010, associated with a slight increase of 343 hectare edged area forest whereas overall forest cover reduced significantly. Later, positive changes result 503 hectare increase in core areas along with 762 hectares decrease in patched forest from 2010 to 2015 which is surely a good sign.
Introduction
Forests are considered as home to most world’s species but massive deforestation in the last century reduced world’s forest cover. The loss of forest cover has become one of the considerable global concerns because of its effects on biodiversity and climate change. As forests are decreased ecosystem services derived from forests has considerably become lower [1]. Large areas of tropical forest now exist as remnants scattered across agricultural landscapes, and so understanding the impacts of forest fragmentation is important for biodiversity conservation [2]. Fragmentation has been defined as the conversion of large areas of contiguous native forest to other types of vegetation and/or land use leaving remnant patches of forest that vary in size and isolation [3]. Habitat fragmentation is a major cause of biodiversity erosion in tropical forests [4]. According to the study of Gibson et al. (2013), [5] within 25 to 26 years of fragmentation 50% of the native species disappears. There were around 13 million hectares (ha) of forest lost worldwide each year between 2000 and 2010, either through devastation by natural causes or because the land was converted to other land uses. Between 2000 and 2011, over 60% of economies in the Asian region was either expanded or retained the area devoted to agriculture and five of the 10 economies with the highest rates of deforestation in 2012 were located in Southeast Asia. Among the south Asian counties, the rate of deforestation in Bangladesh is 0.18% [6]. In this context, it can be assumed that high population density [7] and small land area continuously exerts pressure on forest for fulfilment of basic needs i.e. food, shelter, fuel and even livelihood. Many empirical researchers found that many of forest lands were occupied either by agricultural land or settlements inside forest area and Bangladesh is not an exception.
Rapid pace of deforestation and logging in this tropical countries may lead the forest areas to wide spread fragmentation [8]. Recent research on global forest cover shows that 30 percent of global forest cover has been cleared, while another 20 percent has been degraded. Most of the rest has been fragmented, leaving only about 15 percent intact. In recent decades, human development pressures have results in conversions of vast tracts of tropical rain forests to agriculture and other land uses. As a result, remaining forests had become a victim of fragmentation and divided into smaller habitats [9]. Any land use change can potentially result in fragmentation and much of the forested landscape was fragmented by land clearing for timber and agriculture, some of the most serious fragmentation has been caused by urban sprawl [3]. Haddad et al. (2015), [10] revealed that nearly 20% of the world’s remaining forest is within 100 m of an edge in close proximity to agricultural, urban, or other modified environments where impacts on forest ecosystems are most severe and more than 70% of the world’s forests are within 1 km of a forest edge. Where fragmentation continues, Zhu, Xu, Wang, & Li (2004), [11] observed microclimatic differences which induces buffer effect (edge effect), change of species composition, change in species richness and species (with small population) extinction and parasitic disturbance. Besides Costero (2009), Laurance (2004) [12,13] and Laurance et al. (2011) [14] discussed about abiotic alteration from forest fragmentation which affects habitats of both floral and faunal community. Extinction cascades are likely to occur in landscapes with low native vegetation cover, low landscape connectivity, degraded native vegetation and intensive land use in modified areas, especially if keystone species or entire functional groups of species are lost [15]. Broad-scale destruction and fragmentation of native vegetation is a highly visible result of human induced land use change throughout the world [16]. Multiple regression analysis of a case study showed that human induced land use change is an important determinant of forest fragmentation [17]. However, forests may be fragmented by a number of activities or events, such as road construction, logging, conversion to agriculture, or wildfire, but ultimately, the fragmenting cause is either anthropogenic or natural in origin [18].
The ecological consequences of forest fragmentation may depend on the spatial configuration of the fragments within the landscape and how the configuration changes both temporally and spatially. Three spatial attributes of fragmentation may be particularly important: core area, shape, and isolation of forest fragments [19]. While field ecologists routinely measure the abundance of species or the structure of biological communities at point locations within fragmented landscapes and then relate these measures to metrics of habitat fragmentation, such studies typically focus on biological responses to one or a few attributes of the fragments or landscape such as area, edge-effect, shape, isolation, landscape forest cover, or matrix quality [19].
The importance of forest fragmentation leads the researchers to innovate new and reliable tools to analyze large dataset. Now a days, there are some freeware tools to calculate a wide range of fragmentation metrics from mapped data on forest cover. Fragmentation metrics provide a means of quantifying and describing forest fragmentation. The most common method of calculating these metrics is through the use of Geographic Information System software to analyse raster data, such as a satellite or aerial image of the study area [20]. Vogt et al. (2007), [21] proposed morphological image identification rather than a fixed-area ‘window,’ or kernel, is centred over each pixel on a forest map, and an index is calculated according to the amount and adjacency of forest in the window. This result is then assigned to the forest pixel located at the window centre, thus building a new map of the fragmentation index values. However, in this study authors used landscape fragmentation tool, a freeware third party tool, run on ArcGIS to identify potential areas of forest fragmentation in the landscape of Chunati Wildlife Sanctuary (CWS). This was first declared as wildlife sanctuary in Bangladesh and considered as an important corridor for Asian elephant movement. Like other parts of the country, population pressure and other anthropogenic activities are affecting nearby forest and are eventually destroying forest ecosystem. Two International organizations, United States Agency for International Development (USAID) and The Deutsche Gesellschaft für Internationale Zusammenarbeit GmbH (GIZ), are working to restore the condition. Several project reports have been published and even land use maps were published but none tried to calculate forest fragmentation to assess the intactness of forest. So there is still a lot of data deficit regarding fragmentation. Several researchers have attempted to work on forest fragmentation especially in USA [21-24] and Amazonia [8,9,14]. Among the south Asian countries, fragmentation was documented only for India and Nepal [25,26] by using remote sensing technology. In Bangladesh, there was only one initiative taken so far to measure forest fragmentation of the Sundarbans [27].
However, anthropogenic pressure is continuously impacting on the existing forest ecosystem and present condition has been assessed through this research and hopefully will help to understand recurrent situation and impact of implementation of conservation project with a new dimension.
The purpose of this study is to map and assess the forest cover and forest fragmentation of CWS using satellite imagery obtained from the Landsat-7 and Landsat-8 satellites, which was collected in 2005, 2010 and 2015. Specifically, the objectives of this forest fragmentation study, which employed remote sensing techniques, are to:
To produce land use map and compare changes of land uses using Landsat satellite imageries of CWS from 2005 to 2015; and
To identify and assess the change of core, perforated, edged and patched area of CWS using three different time frame satellite data.
Study area
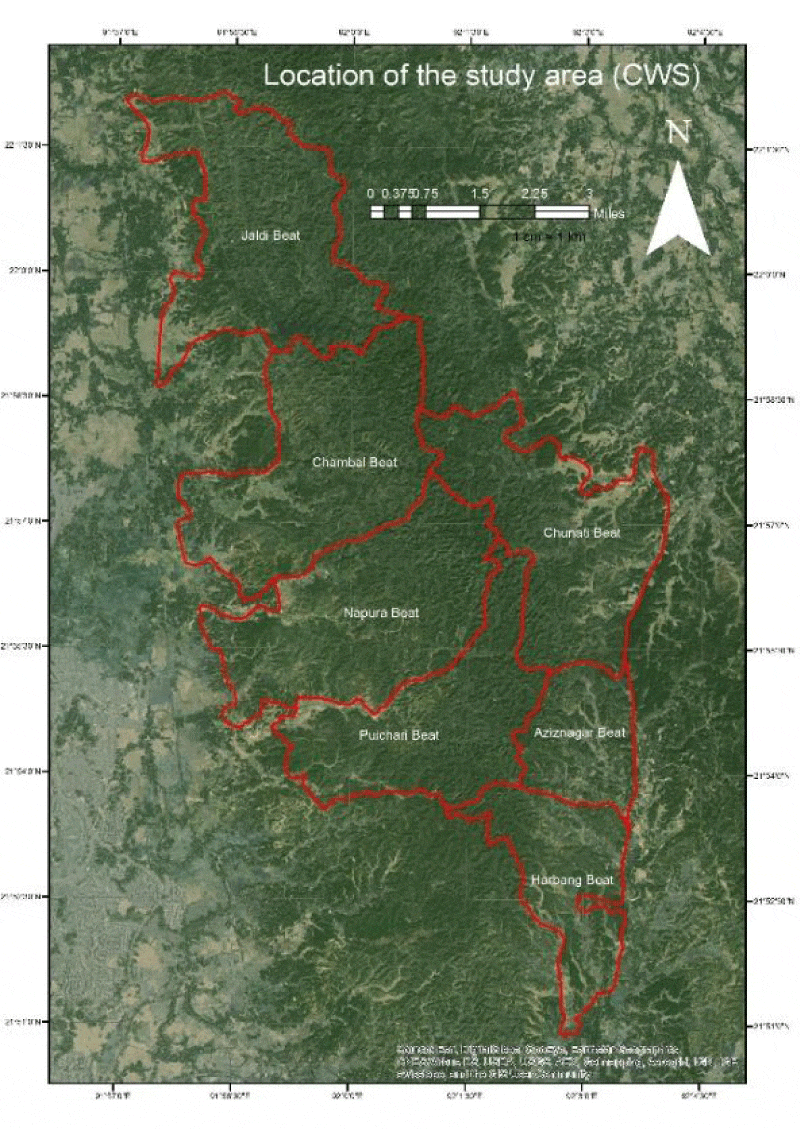
CWS was first declared as wildlife sanctuary in Bangladesh in 1986. CWS comprises an area of 7,764 ha and consists of seven reserved forest (RF) blocks/beats i.e. Jaldi, Chambal, Napura, Puichari, Chunati, Aziznagar and Harbang. The geographical extent of the whole study area lies in between 21050/52.584// to 2201/52.116// N and 91056/46.291// to 9204/3.136// (Figure 1).
However remote sensing analysis of the whole CWS area estimated an area of 10,822.77 ha with more than 3,000 ha of extra land area which might be private land and could not be separated from this study due to lack of proper official documents. It is 70 km south of Chittagong City on the west side of Chittagong-Cox’s Bazar highway in the Chittagong Civil district and managed by Wildlife and Nature Conservation Division, Chittagong. It was originally a part of Chittagong Forest Division. On splitting of Chittagong Division into two Forest Divisions viz. Chittagong (North) and Chittagong (South) Forest divisions, Chunati area fell under the jurisdiction of Chittagong South Forest Division and later handed over to newly created Wildlife and Nature Conservation Division, Chittagong [28].
Methodology
Satellite data
For base map preparation of the study area series of satellite imageries were acquainted from Google Earth 7.0v which was combined manually and used as field level investigation for feature recognition.
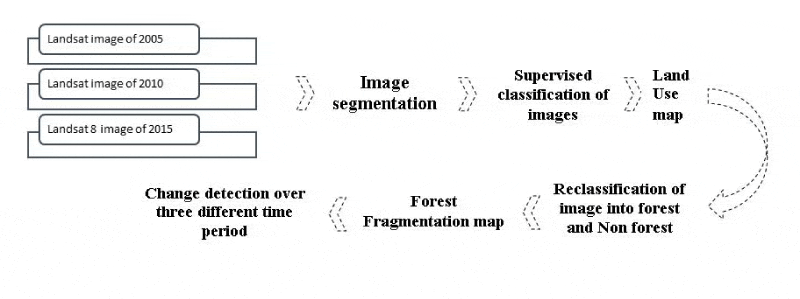
The latest high resolution satellite imagery provided by Google Earth and NASA-GLCF (Global Land Cover Facility ) Archive (freely downloadable worldwide) for Landsat TM and USGS for Landsat 8 OLI-TIRS satellite imagery (2005-2015) were used for visual image interpretation, land use identification and land use classification. All of these Landsat TM and Landsat 8 OLI-TIRS sensors have spatial resolution of 30m (Table 1).
Methodology for land cover classification
For image interpretation ERDAS Imagine 14 and ArcGIS 10.1v software are used to prepare land use map of study area considering field survey data using Google earth imagery to identify different categories of land use. GPS survey was conducted at field level in all seven beats of CWS areas for land use category identification. Total 220 GPS coordinate points were collected from whole CWS areas only for land use category identification. Cross validation of same category, in individual beat was verified through pixel colour tone. From these coordinate values of land use signature, we have randomly selected and used these data as a signature during supervised image classification stage. Based on the priori knowledge of the study area for over 10 years, historical satellite data was used and a detailed survey in seven beat areas of CWS during this study time along with additional information from previous research and mid-term evaluation land use change data, a classification scheme was developed for the study area where finally 6 categories of land use (Table 2) was finally identified and considered for this study based on standard land use classification after Anderson, (1976). As the main objective is to identify overall change of different land uses and to identify forest fragmentation from 2005-2015, plantation and secondary forests are taken as different categories. After a certain period plantation will be matured and if not extracted, it will be turned into natural patches. Here only natural patches and mixed forests are considered as forest and remaining types are considered as non-forest categories. The classification scheme developed gave a rather broad classification where the land use was identified by a single digit. ERDAS Imagine 14 software was used to compliment the display, processing and classification of the data into different classes.
Before field investigation a preliminary legend was developed and checked with Google earth high resolution satellite data at ground level and after signature verification with 2015 Landsat OLI-TIRS satellite data, a standard legend was finally established during image interpretation and classification phase. The 2005 Landsat imagery depicts a situation that shows the scenarios of 10 years before Landsat Imagery of 26 March 2015. Before 2015, all images were cross-checked with recent ground truth data whether the pattern existed in that time period or not. During supervised image classification, maximum likelihood classifier was used to identify the land use types.
Methodology for forest fragmentation
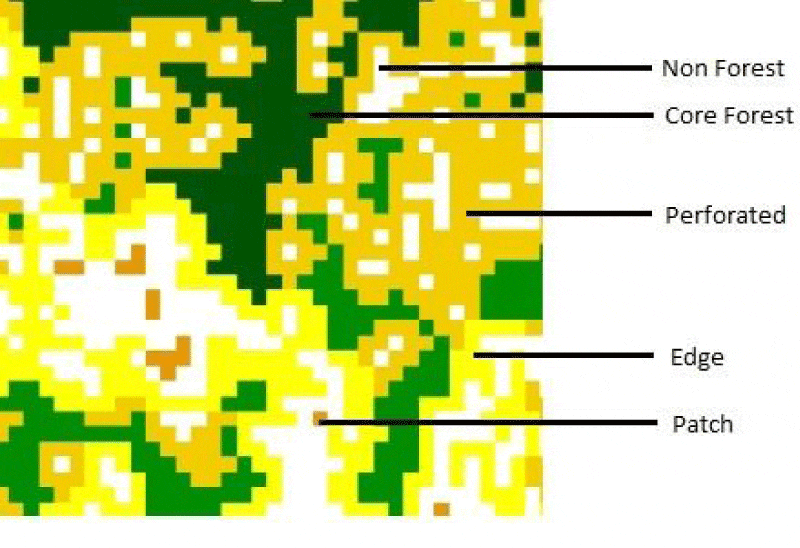
The ArcGIS landscape fragmentation Tool (LFT v2.0), a third party tool developed by Centre for Land Use Education and Research (CLEAR), was used to study forest fragmentation and edge effects and forest type classes as described by Vogt et al. (2007). LFT v2.0 can quantify forest fragmentation from raster land cover maps. The land cover maps of 2005, 2010 and 2015 were reclassified into forest and non-forest classes using ArcGIS spatial analyst. Hence forth, using a specified edge width of 50m, landscape fragmentation tool classified a land cover type of interest into 4 main categories - patch, edge, perforated, and core. ‘Core’ forest was further divided into ‘small core’ (<101.17 ha), ‘medium core’ (101.17–202.34 ha) and ‘large core’ (>202.34 ha) areas. The main categories are defined based on an edge width parameter. The edge width indicates the distance over which a fragmenting land cover can degrade the land cover of interest (i.e. forest). The width of ‘edge effects’ varies with the species or issue being studied and can range from 25 meters to several hundred meters. In this study, 50 m width was considered as edge width according to peer opinion as the forest was already fragile (Figure 2).
The four forest classes can be seen on Figure 3. In this study, core pixels are sub-classified into 3 categories (and three shades of green) - small core, medium core, and large core - based on the area of a given core patch. The next least-disturbed category, perforated pixels, make up the interior edge of small non-forested areas within a core forest, such as a house built within the woods. These areas, which appear as “holes” or perforations, are shown in light orange. Edge pixels, shown in yellow, make up the exterior periphery of core forest tracts where they meet with non-forested areas. The most disturbed category, patch pixels (dark orange), are small fragments of forest that are completely surrounded by non-forested areas.
Results and Discussion
Land use pattern and forest fragmentation of CWS
To know the past land use pattern of the study area, firstly the authors try to focus on Landsat TM imagery for the year 2005 and band combination 5, 4 and 3 were used for image analysis, where different land use categories have been identified and used as past reference with the 2010 and present scenarios (2015) of Landsat 8 OLI-TIRS satellite data was obtained from band combination 7, 5 and 4. The identified land use pattern is verified in cross examination way at present context, whether the category exists or not or converted into another pattern. Prior ground knowledge was required and needed to apply during pattern recognition stage of supervised image classification. By applying ground knowledge researcher can easily identify the specific pixel or collect signature to verify each land use category during image classification stage discussed in Table 2. Total 10822.77 ha of land area was estimated after supervised image classification using ERDAS Imagine 14 software.
Status of CWS in 2005: As per discussion total land area has been divided into six major categories (Table 2). According to the main research objective, whole area again have been categorized into two categories viz. forest and non- forest. From identified pixels, total pixels of each type have been calculated to find out land area occupied by each type.
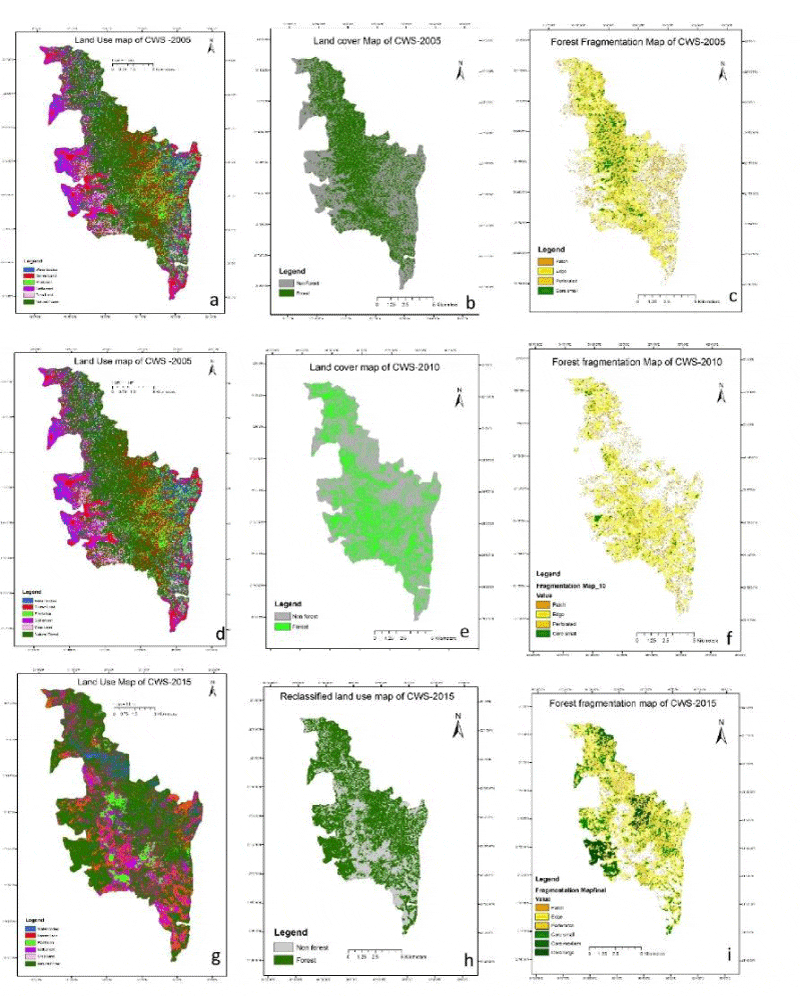
From Table 3, it is seen that in 2005 forest and non-forest land use occupied equal amount of land parcel, nearly 50% each. Among the non-forest categories maximum land has been found as barren land (14.83%) which is mainly comprised of grazing land, fallow land and degraded forest land (Table 3). This type shared nearly 1604 ha land area. Besides this category, few other land use practices were dominant in the study area in 2005 which were identified during classification stage i.e., settlements covered 1320 ha of land sharing 12.19% and Crop land occupied 1042 ha of land sharing nearly 10% of total land, remaining land uses were plantation (6.7%) and water bodies (5.76%). In land use map, light green patches show presence of forest in the study area in 2005. Other land uses i.e. barren lands, water bodies, crop lands, settlements and plantation are shown respectively by red, blue, pink, violet and pale green pixels (Figure 4a).
To obtain a forest fragmentation map, land cover map has been modified into forest-non forest cover map (Figure 4b). In 2005, study area of Chunati had 5507 ha of forest land presenting 50% of the total area. Among the forested land only 14% land were considered as least disturbed and mentioned as core forest and it shares about 1830 ha of the study area. In map it is shown by light green colour which signifies the area do not have any other land uses within 50 meter and core area is less than 100 ha (Figure 4b).
However, the next least-disturbed categories are shown by light orange colour and appear as small holes within the wood lands (Figure 4c). Forest fragmentation map of 2005 shows perforated forests have occupied 35% of total forest land and edged forest shared 30% of it (Figure 5a). Edge pixels are yellow in colour and make exterior periphery of core forest tracts where they meet with non-forest areas (Figure 4c). Most disturbed categories are patches pixels and those are shown by dark orange colour in map which means this forest has more amount of maximum disturbed forest than least disturbed area and most of the forest areas were vulnerable to change into other land uses and low core zone also reduces the chance for viability of pollination and seed dispersal.
Status of CWS in 2010: After 2005 land use classification, land use pattern of 2010 was visually interpreted through ERDAS imagine 14v (Remote sensing software) which was used as the base year for identification of changes of land use categories from this time to present context also. Based on 2010 image classification result, nearly two third of the total study area was occupied by non-forest land uses. Non forest land uses comprised about 6771 ha (62.57%) of land and Forest only shares the remaining 37.43% of land parcel (Table 3).
The highest land use identified was barren land which was also highest in 2005 and presented in map with red colour (Figure 4d). Second highest category of non-forest land uses was crop land which comprised about 15% of the study area and occupied 1626 ha of land (Table 3).
Besides this category, few other land use practices were dominant in the study area in 2010 which are i.e., settlement with homestead trees contained 1243 ha and it shared 11.5%, plantation covered 1247 ha and 11.33% land parcel (Table 3).
Modified forest and non-forest map of the study area showed significant deforestation in 2010 (Figure 4e). In 2005, study area of Chunati had 5507 ha of forest land presenting 50% of the total area but in 2010 it shows only 37% of forest land (Table 3).
Dark orange pixel shows patched forest and it comprises about 27% land area. Least disturbed group is shown with green colour and considered as core as per this study (Figure 5b). Map analysis shows that only 7% core (Figure 4f) has been found in 2010 where apparently least vulnerable small holes in and around the core regions shows perforated forest land. This type occupies about 17% forest land cover (Figure 5b) comprising about 712 ha land (Table 3). Perforated patches are shown in light orange colour in map. Another vulnerable group is edged forest land where there is a presence of other land uses within 50m and may lose their viability and might convert into other land uses. In fragmentation map (Figure 4f) edges are shown in yellow colour. It occupies about 49% of land which means half of the forest land is vulnerable and highly affected by other land uses (Figure 5b).
Status of CWS in 2015: Recently satellite data of Landsat 8 OLI-TIRS have been updated, worldwide available and provided by USGS. 11 numbers of bands are exist in that available scene, Path 136, Row 045, date of acquisition 26 March, 2015 is considered for land use classification ultimately to know the land use scenario of CWS at present context after 2010. After 2010, due to the alarming situation of CWS few important projects were executed in the recent past for its assessment. According to extracted data of land use classification of 2015, distinct improvement cab easily be identified with bare eyes and green pixel occupied more space than it was in 2010 and 2005 (Figure 4g). Forest coverage in 2015 significantly increased up to about 60% whereas Non forest land uses possesses 40% of land (Table 3).
Among the non-forest land covers, highest proportion was occupied by barren land which covers 1417 ha of land and shares about 13.11% land though it decreased than that of 2015 (Table 3). The second highest one is crop land sharing 1368 ha (12.64% of land) which was little bit reduced from 2010 and obviously is a good sign for forest. Due to dry season, maximum water bodies were in dry up condition and is found 248 hectare of land (2.32%). Among the rest of the categories households pervades 835 ha of land which comprises 7.71% of total land. Forest plantation is showing decreasing status than 2010 which is 516 ha (4.7% of 1and) (Table 3).
According to reclassified (Figure 4h) land cover map, green pixels of natural forest cover increased significantly and dense areas of wood land can be easily identified in the map (Figure 4h). This happened because of rehabilitation initiatives. In forest fragmentation analysis least disturbed forest areas are designated as core forest. In 2005 and 2010, we found only core areas having intensive forest areas having core of less than 250 acres (101.17 ha). These core areas are known as core small and light green pixels in the map shows the presence of small core region. In 2005 and 2010, no core medium and core large has been found.
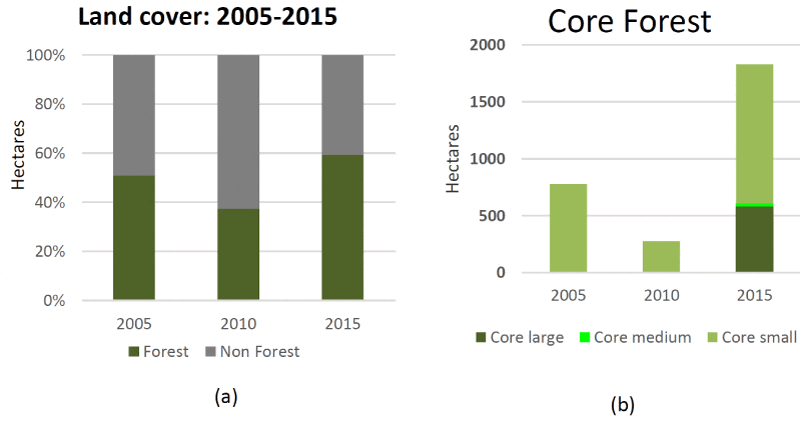
But in 2015, significant area has been found under core large category and small proportion has been found as core medium category. In forest fragmentation map of 2015, dark green portion signifies the presence of core large which have patch size more than 500 acre (202.34 ha) of land. Core large occupies 581 ha of wood land where as core medium only shares 29 ha of forest land (Figure 5c). Forest patches having an undisturbed area in between 250-500 acres (101.17–202.34 ha) are known as core medium. Again in 2015, 1220 ha of land has been fallen in core small categories because of having dense patches less than 250 acres (101.17 ha). According to the presence of green pixels cumulative core regions shares 1830 ha of forest land (Table 3) and occupies about 30% of total forest area (Figure 5c). After core regions least disturbed areas are denoted as perforated area having a pixel colour of light orange in the map. In 2015, perforated forest patches have occupied 2595 ha (Table 3) of land and seen as “holes” in the map (Figure 4i). Yellow colour shows the presence of edges and it signifies the presence of other land use within 50m and this type comprises about 26% of forest land (Figure 5c). But more importantly, maximum disturbed areas having dark orange pixels reduced significantly. Reduction of patches means forest condition is rehabilitating and in 2015, patches only comprise about 5% of the forest land.
Land use change assessment of CWS based on different time frame (2005-2015)
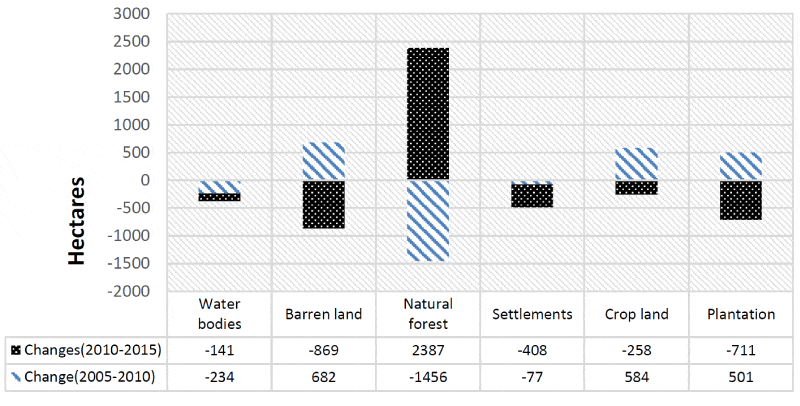
To assess the change scenario from 2005 to 2015 whole time frame has been divided into three time intervals i.e., 2005-2010; 2010-2015 and the overall change assessment (2005-2015). Changes of different land use types in different time frames have been depicted in the following win and loss graph (Figure 6).
Land use change assessment of CWS (2005-2010): From 2005 to 2010, natural forest has been reduced significantly and magnitude has been changed up to 254 ha. So these forested areas have been deforested. Accordingly other non-forest areas have been increased rapidly in this time period. Proportion of barren land and crop land increased 682 ha and 584 ha respectively (Figure 6). Due to massive deforestation, plantation activity has been seen and total increase in plantation was 501 ha which was significant but not well enough to cover up damages that already had been done. Again another threat for forest was reduction of water bodies. From win-loss columns it is clear that wetlands had been decreased (Figure 6).
On the contrary, positive improvement was noticed in settlement land use categories and land area occupied in this category had been reduced to 77 ha.
Land use change assessment of CWS (2010-2015): As the CWS areas was passing hard time to save its natural forest and after 2010 CWS has experienced several improvement projects. After 2010, Natural forest has been increased to 2387 ha which is obviously a sign of positive change (Figure 6). On the contrary other non- forest uses have been reduced i.e. areas occupied by barren land reduced to 869 ha, settlements has been reduced to 408 ha, and crop land has been reduced to 258 ha (Figure 6).
On the other hand, negative change has been observed in plantation land use category. Land area occupied by plantation has been decreased to 711 ha. Besides, water bodies have also been reduced and 141 ha of reduction are observed (Figure 6).
Overall land use change assessment of CWS (2005-2015): The overall scenarios of CWS are assessed based on 2005-2015 dataset which was calculated from Figure 5. From 2005- 2015, 931 ha of forest land has been added to forest land cover. On the contrary, similar amount of non- forest land uses has been reduced. Among the land use categories, only settlement and water bodies decreased in both the time periods and all other land use categories showed different trends. Overall, 375 ha of wet land has been reduced, 485 ha of settlements has been shifted from inside of CWS, 187 ha of barren land has been reduced, 326 ha of crop land increased, 210 ha of plantation has been destroyed from 2005 to 2015.
Forest fragmentation assessment of CWS (2005-2010)
Assessment of changes during the study period of 2005-2015 has been divided into three time frames i.e. 2005-2010, 2010-2015 and overall change (2005-2015).
Forest cover type changes (2005-2010): In 2005, there were about 5507 ha of forest land under forest cover type and it shares about 51% of the total land (Figure 7a). On the other hand, Non-forest land category occupied 49% of land. But In 2010, forest land has been reduced to 1456 ha (Figure 6) and other Non-forest land uses replaced forest coverage.
In this study, total area has been divided into four categories i.e. core, perforated, edge and patch. Core area has again divided into three categories viz. core small, core medium and core large. So areas occupied by different types will represent qualitative and quantitative assessment of forest. In 2005, core area (including three subdivisions) shares 778 ha of land and in 2010, core area significantly reduced to a land area of 275 ha (Figure 7b). So core area loss within this five year was 503 ha. As previously discussed, core area is less vulnerable to change into other land use category. In 2005 and 2010, all the core areas that have been identified fall under core small category which means core area are less than 250 acre (101.17 ha). After core area, less vulnerable area is perforated area.
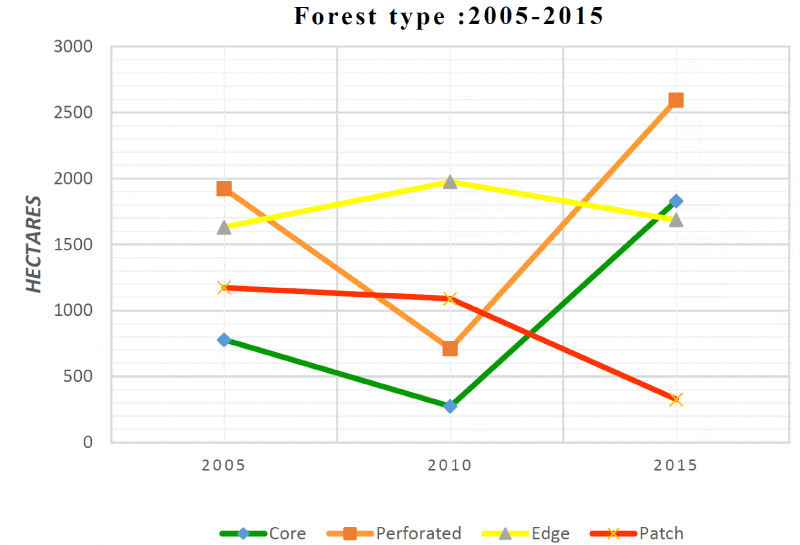
In 2005, perforated area was 1924 ha and in 2010 the area was 712 ha which ensued a total of 1212 ha of loss of perforated area (Figure 8). On the other hand, edge region has been increased from 1632 ha to 1975 ha and resulted net increase of about 343 ha. Lastly patches remained almost same with a slight loss of 84 ha of land (Figure 8).
Forest cover type changes (2010-2015): To assess forested ecosystem, forest tree cover assessment is not the only parameter to consider. So to identify forest fragmentation, forest cover has been divided into four categories as discussed above. In 2010, there was no core large proportion and only few amount of core small has been found from the study. But in 2015, core forest has been increased significantly and in 2015 core forest coverage shares 1830 ha. There was no core large region in 2010 but in 2015 core large region developed substantially. A total increase in forest area also resulted increase in perforated proportion and reduced patch regions. With the increment in core region, edge reduced to 279 ha (Figure 8).
Overall changes of forest types (2005-2015): During the study period of 2005 to 2015, CWS lost about 1456 ha of forest to other non-forest uses in 2010 but the scenario has been changed in 2015. CWS regained some of its natural healing and net increment is 931 ha of forest land. Loss of core forest (only core small in 2010) from 2010 to 2015 was about 553 ha and regain of core forest was about 1555 ha and net increment is 1052 ha. From 2005 to 2010, core regions were not only disappeared, but it also affected other three categories (Figure 8).
With core regions, perforated and patched forest lost their shared area only but edges increased meaning no-forest land uses were found adjacent to the forest area. But due to implementation of several projects, conservation initiatives and willingness of Forest Department, core regions have gained significant improvements as well as edges are reduced. However, the bad news is that perforated coverage is the highest proportion of forest cover meaning non-forest land uses are practiced in limited area but with the absence of conservation initiatives this forest can again be encroached by local people and scenario may change like 2010.
Conclusion and Policy Implications
Over a period of 2005-2015, CWS has experienced two fold scenarios. From 2005 to 2010 this area faced tremendous deforestation and from 2010 to 2015 it has shown a lot of improvement in terms of forest cover and defragmentation. There was a substantial decrease in forest cover and an increase in cropland and barren land in the first five years (2005-2010). This study is in conformity with Islam et al. (2016). The results indicate that forest fragmentation is strongly correlated with change of land use. Extensive non-forest land use creates small patches and eventually results in increasing of edged and patched areas. On the other hand, CWS has experienced a substantial restoration intervention in forest conservation scheme. Non-forest land uses decreased in the five years of the current decade thus core areas started to appear and edged -patched area decreased significantly. As mentioned above, reduction of patches indicates improved condition of forest ecosystem and means forest is less disturbed while it was severe before. Non-forest land use may lead to critical forest degradation with implications for biodiversity, ecosystem services, and peoples’ livelihoods (see literature review section). As CWS is a protected area declared under IUCN category IV, habitat conservation for wildlife is the prime objective of forest management and there should be no issue regarding forest harvesting. Forest fragmentation induces species loss and other related problem accordingly which enhanced habitat fragmentation and habitat degradation for both floral and faunal community. It is very likely that with the reduction of the interior forest species using that habitat starts to disappear. Once an interior forest area is disturbed, only removal of development and extensive re-growth time can restore the forested area. Even if such conditions occur, the biodiversity and forest health have been compromised, and a return to pre-disturbance conditions would typically require many decades to several hundred years, depending upon the forest conditions and species mix.
However, the study further suggests that conservation activity i.e. alternative income generation of forest dependent people, community patrolling of forest and implication of existing rules and regulation may check further expansion of non-forest activity. The study fills an information gap in a poorly researched area with poor data availability, improves the information base at national and regional scales, and may contribute to understanding of global change. This study may help in future landscape planning in this region and helps to consider any development and restoration interventions. As this area is considered a biodiversity hot spot and corridor for Asian elephant (Eliphus maximus) forest fragmentation in this area really matters. In particular, the results will be useful for planning landscape connectivity and corridors, which are important for conserving biodiversity and maintaining the flow of ecosystem services.
Forest ecosystem is a dynamic system and it needs regular monitoring. So the forest change over time will be analysed regularly. Many anthropogenic activity, population density, forest fire may reduce large amount of forest cover. As the study area is under conservation scheme, it is expected regular monitoring will help to compare whether already deforested areas start to gain young forests or further deterioration incurs. If there is significant variable data available for different time periods it will help to simulate the future land use which again will help to measure future probability of further forest fragmentation. Additional future research will focus on the vulnerability of deforestation and future degradation of forest areas.
According to the ecologists, the wildlife experts, the water resource experts, and the foresters’, un-fragmented forest areas are prime need for wildlife habitat, clean water and forest viability. However, this study shows that fragmentation in between 2005-2015 and the loss of core forest areas within first five years and progress of core areas from 2010 to 2015.
From the overall assessment of this study, it has been clearly noticed that forest cover is changing in the study area. Natural forest was still less and mixed pattern of forest is dominant throughout the CWS areas. Though, situation is improving a lot in certain category rather than its previous condition of 2005 and even 2010. Both the present and the future generations stand to suffer bitter consequences if we are not concerned about its management. If necessary steps are not taken to save the forest, this valuable resource will definitely get depleted in future.
The quality of this manuscript is improved from the comments and suggestions of anonymous reviewers and the editor of the journal. The authors like to thank them for their works. We are also grateful to our colleague Suriya Yeasmin for her time in proof reading and language editing of this manuscript. Special thanks to Mr. Abhijeet for his co-operation during the whole publishing process.
- Islam K, Majumder S (2015) Economic evaluation of Foy's Lake, Chittagong using travel cost method. Indian Journal of Economics and Development 3. Link: https://goo.gl/r2fsMW
- Hill JK, Gray MA, Khen CV, Benedick S, Tawatao N, et al. (2011) Ecological impacts of tropical forest fragmentation: how consistent are patterns in species richness and nestedness?. Philosophical Transactions of the Royal Society of London B: Biological Sciences 366: 3265-3276. Link: https://goo.gl/YHOXAs
- Thomson MJ (2003) Forest Fragmentation (1–3). Don Mills, Ontario: Federation of Ontario Naturalists 355 Lesmill Road. Link: https://goo.gl/phYauM
- Tabarelli M, Mantovani W, Peres CA (1999) Effects of habitat fragmentation on plant guild structure in the montane Atlantic forest of southeastern Brazil. Biological Conservation 91: 119–127. Link: https://goo.gl/aZagaQ
- Gibson L, Lynam AJ, Bradshaw CJ, He F, Bickford DP, et al. (2013) Near-complete extinction of native small mammal fauna 25 years after forest fragmentation. Science, 341(6153), 1508–1510. Link: https://goo.gl/s3JPkF
- ADB (2010) Key indicator for Asia and the Pacific (1– 312). Mandaluyong City, Philippines: Asian Development bank. Link: https://goo.gl/jEQq1C
- Rahman MF, Islam K, Islam KN (2016) Industrial Symbiosis: A Review on Uncovering Approaches, Opportunities, Barriers and Policies. J Civil Eng Environ Sci 2: 11-19. Link: https://goo.gl/kMQr76
- Gascon C, Bierregaard RO, Laurance WF, De Mérona JR (2001) Deforestation and Forest Fragmentation in Amazon. In Lessons From Amazonia The Ecology And Conservation Of A Fragmented Forest (14–21). London: Yale University Press.
- Numata I, Cochrane MA (2012) Forest Fragmentation and Its Potential Implications in the Brazilian Amazon between 2001 and 2010. Open Journal of Forestry 02: 265–271. Link: https://goo.gl/boJZpu
- Haddad NM, Brudvig LA, Clobert J, Davies KF, Gonzalez A, et al. (2015) Habitat fragmentation and its lasting impact on Earth’s ecosystems. Science Advances, 1(2), e1500052–e1500052. Link: https://goo.gl/cs4iWB
- Zhu H, Xu ZF, Wang H, Li BG (2004) Tropical rain forest fragmentation and its ecological and species diversity changes in southern Yunnan. Biodiversity & Conservation 13: 1355–1372. Link: https://goo.gl/VmbUAA
- Costero M (2009) Abiotic alterations caused by forest fragmentation affect tree regeneration: a shade and drought tolerance gradient in the remnants of Coastal Maulino Forest. Revista Chilena de Historia Natural 82: 413–424. Link: https://goo.gl/Y6d7OX
- Laurance WF (2004) Forest-climate interactions in fragmented tropical landscapes. Philosophical Transactions of the Royal Society B: Biological Sciences 359: 345–352. Link: https://goo.gl/ngS1MN
- Laurance WF, Camargo JLC, Luizão RCC, Laurance SG, Pimm SL, et al. (2011) The fate of Amazonian forest fragments: A 32-year investigation. Biological Conservation 144: 56–67. Link: https://goo.gl/qLUw7p
- Fischer J, Lindenmayer DB (2007) Landscape modification and habitat fragmentation: a synthesis. Global Ecology and Biogeography 16: 265–280. Link: https://goo.gl/gviOqI
- Bennett AF, Saunders DA (2010) Habitat fragmentation and landscape change. Conservation Biology for All 93: 1544–1550. Link: https://goo.gl/px2xsh
- Abdullah SA, Nakagoshi N (2007) Forest fragmentation and its correlation to human land use change in the state of Selangor, peninsular Malaysia. Forest Ecology and Management 241: 39–48. Link: https://goo.gl/b0NZSm
- Wade TG, Riitters KH, Wickham JD, Jones KB (2003) Distribution and causes of global forest fragmentation. Conservation Ecology 7: 7. Link: https://goo.gl/ihYBfD
- BIP (2010) Forest Fragmentation: Identifying a biodiversity-relevant indicator. Cambridge, UK: Biodiversity Indicators Partnership. Link: https://goo.gl/Oxq43x
- Meneguzzo DM, Hansen MH, (2009) Quantifying forest fragmentation using geographic information systems and forest inventory and analysis plot data. Link: https://goo.gl/oDHnrW
- Vogt P, Riitters KH, Estreguil C, Kozak J, Wade TG, et al. (2007) Mapping Spatial Patterns with Morphological Image Processing. Landscape Ecology 22: 171–177. Link: https://goo.gl/l86FHx
- Holdt BM, Civco DL, Hurd JD (2004) Forest fragmentation due to land parcelization and subdivision: a remote sensing and GIS analysis. In Proceedings of the 2004 ASPRS Annual Convention, Denver, Colourado. Citeseer. Link: https://goo.gl/pgHP6h
- Riitters KH, Wickham JD, O’neill RV, Jones KB, Smith ER, et al. (2002) Fragmentation of continental United States forests. Ecosystems 5: 0815–0822. Link: https://goo.gl/cK2TnA
- Vogelmann JE (1995) Assessment of Forest Fragmentation in Southern New England Using Remote Sensing and Geographic Information Systems Technology. Conservation Biology 9: 439–449. Link: https://goo.gl/TzXDfj
- Roy PS, Murthy MSR, Roy A, Kushwaha SPS, Singh S, et al. (2013) Forest fragmentation in India. Current Science 105: 774-780. Link: https://goo.gl/ymMCVc
- Uddin K, Chaudhary S, Chettri N, Kotru R, Murthy M, et al. (2015) The changing land cover and fragmenting forest on the Roof of the World: A case study in Nepal’s Kailash Sacred Landscape. Landscape and Urban Planning 141: 1–10 Link: https://goo.gl/oAoMfg
- Syed MA, Hussin YA, Wier M (2001) Detecting Fragmented mangroves in the Sundarbans, Bangladesh using optical and RADAR satellite images. Presented at the 22nd Asian conference on Remote sensing, Singapore: Center for remote imaging, sensing and processing, National University of Singapore. Link: https://goo.gl/qeZ4Be
- Islam K, Jashimuddin M, Nath B, Nath TK (2016) Quantitative Assessment of Land Cover Change Using Landsat Time Series Data: Case of Chunati Wildlife Sanctuary (CWS), Bangladesh. International Journal of Environment and Geoinformatics 3: 45-55. Link: https://goo.gl/LVAlmr
Article Alerts
Subscribe to our articles alerts and stay tuned.
 This work is licensed under a Creative Commons Attribution 4.0 International License.


 Save to Mendeley
